
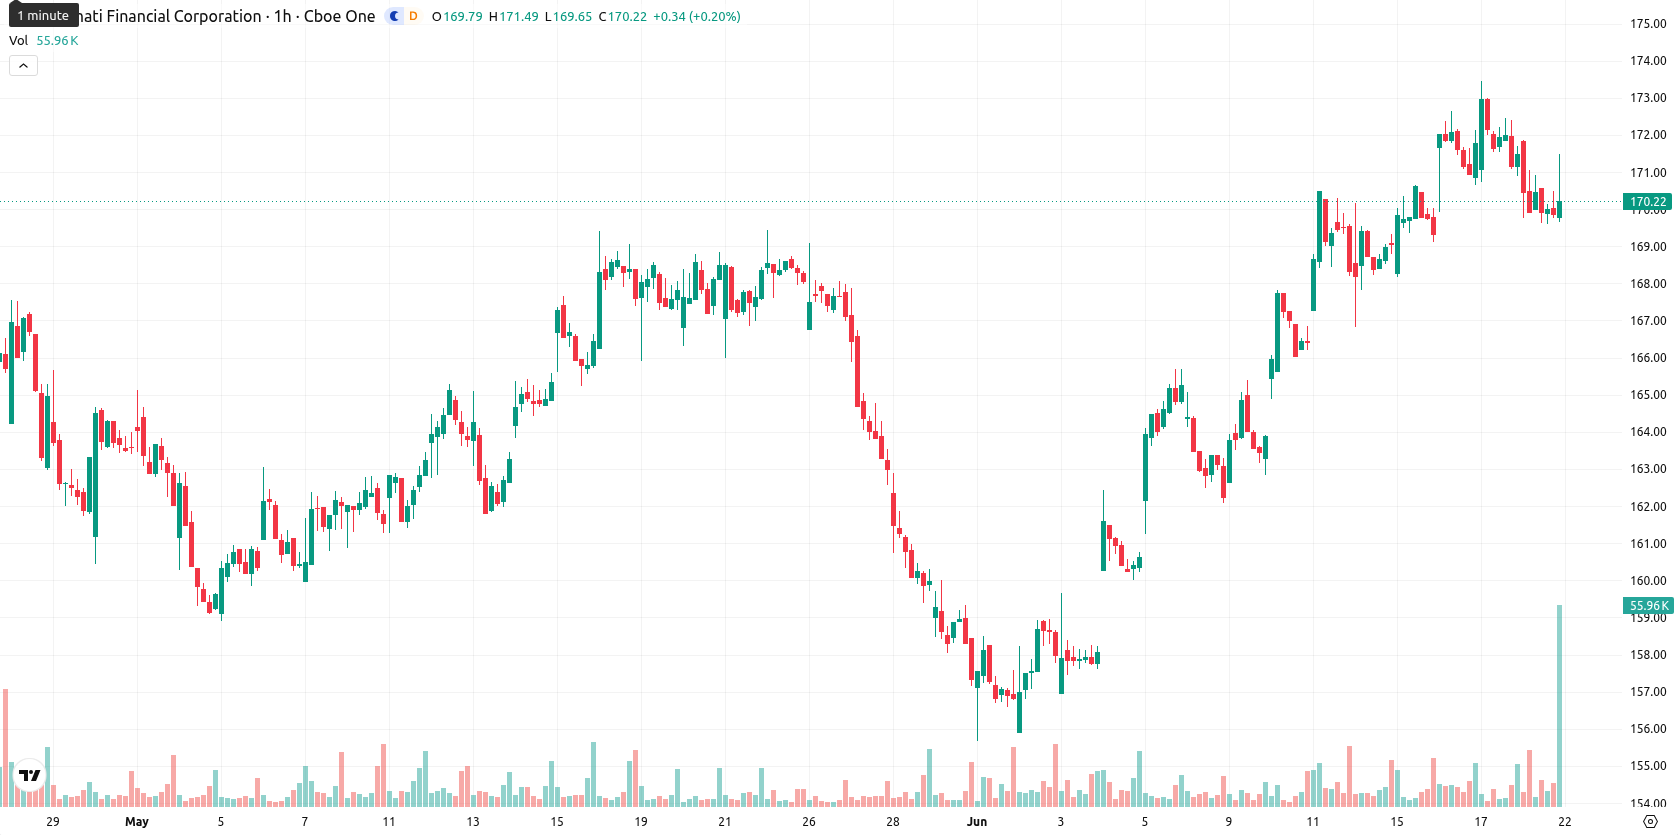
$166.94–$172.90 range contains Cincinnati Financial stock flat movement

Cincinnati Financial (CINF) stock is trading at $169.92, marking a daily decline of 0.9%. The stock sits below its key short-term moving average and above both its medium-term and long-term averages.
Highlights
- Cincinnati Financial maintains a stable 2.23% dividend yield and 7.79% annual dividend growth, backed by solid profitability and low leverage.
- Strong free cash flow and disciplined payout practices underscore the company's ability to sustain and potentially grow shareholder distributions.
- Technicals point to near-term selling pressure with price expected to fluctuate between $166.94 and $172.90, though upward movement is moderately favored.
Dividend stability underpins appeal despite persistent selling pressure
Cincinnati Financial recently achieved a 7 out of 10 dividend rating, reflecting stable shareholder returns based on disciplined payout practices. The company has reported a 2.23% dividend yield and 7.79% dividend growth, indicating increasing cash distributions and income generation for stockholders. Cincinnati Financial is also characterized by solid profitability, minimal debt, and robust free cash flow relative to its market price, supporting ongoing dividend sustainability and capital preservation, though price action has remained under broader selling pressure.
Mixed buy and sell signals as momentum and support levels diverge
CINF is positioned below the 20-day moving average, with support from both the 50-day and 200-day moving averages. The Ichimoku Kijun sits at $170.82, acting as the nearest area of resistance. Momentum signals are mixed: MACD and ADX both flag a buy, while RSI is moderately positive at 50.19 and Stoch RSI points to an oversold condition, suggesting short-term seller exhaustion. Meanwhile, CCI and BBP lean bearish, highlighting ongoing intraday selling flows, and the Awesome Oscillator remains neutral. Oscillator divergence reflects mixed short-term dynamics between continued selling and incipient buying interest.
Sideways movement favored as volatility compresses within defined range
In the near term, CINF is expected to fluctuate within a volatility band of $166.94 to $172.90 over the next 2 to 3 trading days. The most likely scenario is further sideways action inside this range, with a 60% probability that price breaks to the upside. Should CINF move above immediate resistance, additional gains may be triggered, while a decline below key support could accelerate downside momentum.


-
 Afghanistan
-
 Albania
-
 Algeria
-
 Angola
-
 Argentina
-
 Armenia
-
 Australia
-
 Austria
-
 Azerbaijan
-
 Bahamas
-
 Bahrain
-
 Bangladesh
-
 Belarus
-
 Belgium
-
 Bolivia
-
 Botswana
-
 Brazil
-
 Brunei
-
 Bulgaria
-
 Cambodia
-
 Cameroon
-
 Canada
-
 Chile
Chile
-
 China
China
-
 Colombia
-
 Congo
Congo
-
 Costa Rica
-
 Cote d'Ivoire
-
 Croatia
-
 Cuba
Cuba
-
 Cyprus
-
 Czechia
-
 DR Congo
-
 Denmark
-
 Dominican Republic
-
 Ecuador
-
 Egypt
Egypt
-
 El Salvador
-
 Estonia
-
 Eswatini
-
 Ethiopia
-
 Finland
-
 France
-
 Georgia
-
 Germany
-
 Ghana
Ghana
-
 Greece
-
 Haiti
Haiti
-
 Hong Kong
-
 Hungary
-
 India
India
-
 Indonesia
-
 Iran, Islamic republic
-
 Iraq
Iraq
-
 Ireland
-
 Israel
-
 Italy
Italy
-
 Jamaica
-
 Japan
Japan
-
 Jordan
-
 Kazakhstan
-
 Kenya
Kenya
-
 Korea
Korea
-
 Kuwait
-
 Kyrgyzstan
-
 Laos
Laos
-
 Latvia
-
 Lebanon
-
 Lesotho
-
 Libya
Libya
-
 Lithuania
-
 Luxembourg
-
 Madagascar
-
 Malaysia
-
 Malta
Malta
-
 Mauritius
-
 Mexico
-
 Moldova
-
 Mongolia
-
 Montenegro
-
 Morocco
-
 Mozambique
-
 Myanmar
-
 Namibia
-
 Nepal
Nepal
-
 Netherlands
-
 New Zealand
-
 Nigeria
-
 North Macedonia
-
 Norway
-
 Oman
Oman
-
 Pakistan
-
 Palestine
-
 Panama
-
 Papua New Guinea
-
 Paraguay
-
 Peru
Peru
-
 Philippines
-
 Poland
-
 Portugal
-
 Puerto Rico
-
 Qatar
Qatar
-
 Reunion
-
 Romania
-
 Rwanda
-
 Saudi Arabia
-
 Serbia
-
 Singapore
-
 Slovakia
-
 Slovenia
-
 Somalia
-
 South Africa
-
 Spain
Spain
-
 Sri Lanka
-
 Sweden
-
 Switzerland
-
 Syria
Syria
-
 Taiwan
-
 Tajikistan
-
 Tanzania
-
 Thailand
-
 Trinidad and Tobago
-
 Tunisia
-
 Turkey
-
 UAE
UAE
-
 Uganda
-
 Ukraine
-
 United Kingdom
-
United States
-
 Uruguay
-
 Uzbekistan
-
 Venezuela
-
 Vietnam
-
 Yemen
Yemen
-
 Zambia
-
 Zimbabwe
- Forex
- Crypto
