
Limited downside risk restrains Sundial Growers stock decline

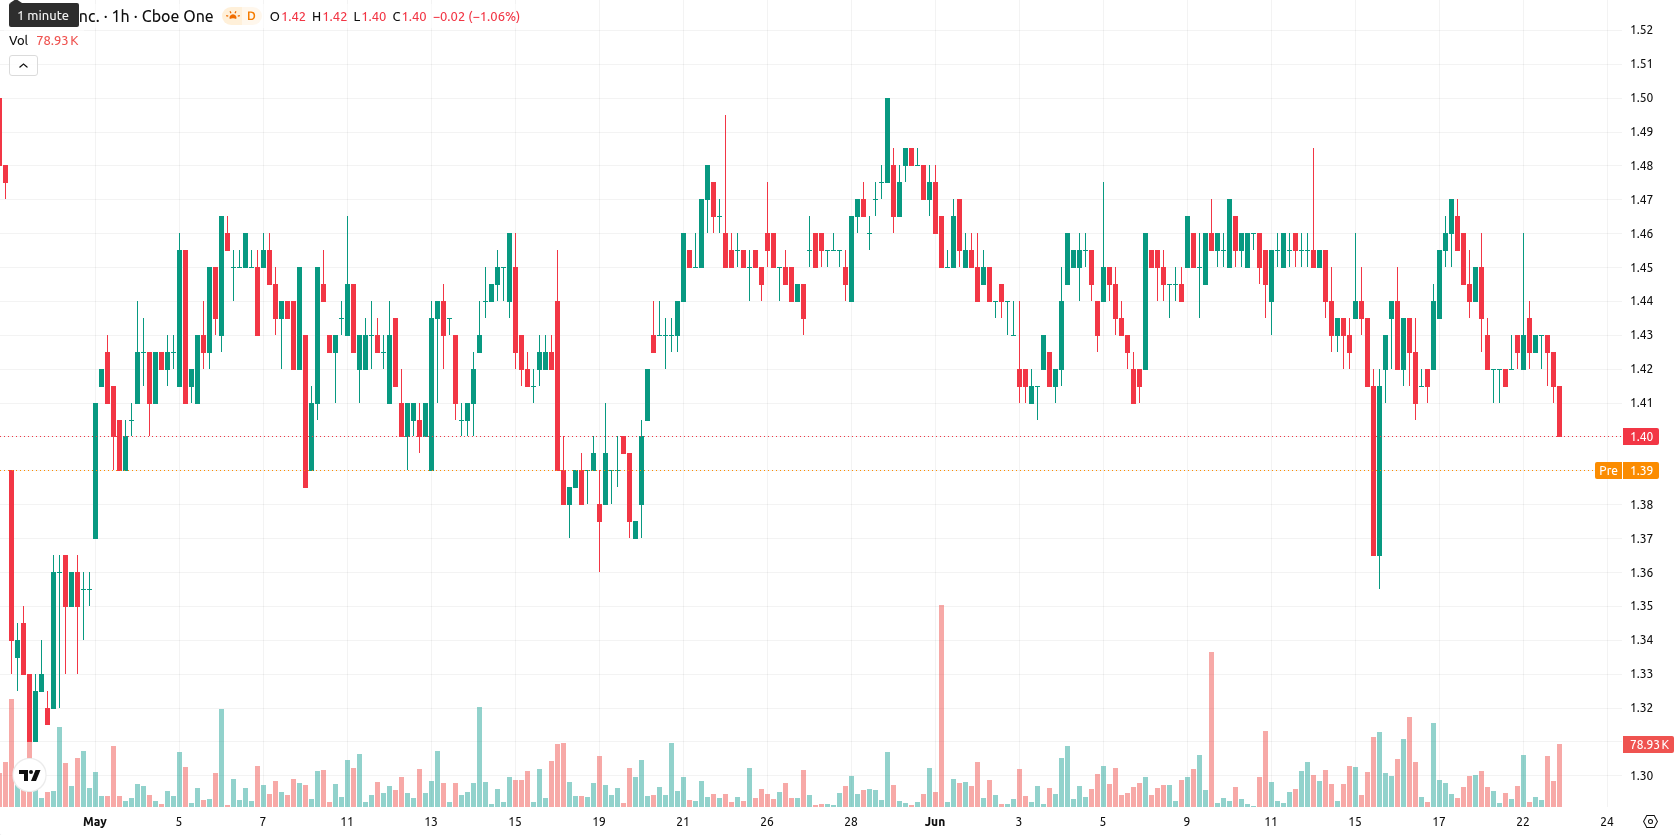
Sundial Growers Inc. (SNDL) stock is trading at $1.41, down 1.4% for the day. The price is currently positioned below its key moving averages, reflecting sustained selling momentum.
Highlights
- SNDL/USD is showing sustained bearish momentum, trading below key moving averages across hourly and daily timeframes.
- Multiple technical indicators, including MACD and AO, confirm sellers currently dominate, with oscillators suggesting near-term exhaustion.
- The pair is expected to consolidate in a $1.38–$1.44 range, with downside risk remaining substantially higher than upside potential.
Multiple technical barriers reinforce downside momentum
On the H1 chart, SNDL is trading below the MA-20 and MA-50, while the daily chart shows price below the MA-200, marking all key levels as overhead resistance. The Ichimoku Kijun line at $1.44 acts as immediate resistance. Momentum indicators remain weak: the MACD signals a sell, ADX is neutral, and RSI registers 40.36 with a sell bias. Short-term oscillators, including Stoch RSI and CCI, have entered oversold territory, signaling some exhaustion. The Bull/Bear Power (BBP) also flashes a sell, consistent with ongoing seller dominance. The Awesome Oscillator further aligns with the prevailing downtrend and no meaningful divergence is present among oscillators.
Low breakout odds as consolidation range narrows with downside risk
Over the next few days, SNDL is expected to trade within a $1.38–$1.44 range, representing its typical volatility band relative to current levels. The probability of an upside breakout is very low, with downside risk markedly higher. Baseline expectations point to continued consolidation within this range; a close above $1.44 is needed for a bullish breakout, while falling below $1.38 would confirm a bearish scenario.
Earlier, analysts noted that Sundial Growers displayed mixed momentum and lacked a clear directional conviction. The current analysis not only reaffirms this cautious outlook but also highlights that sustained selling pressure has shifted the risk profile further to the downside, making a decisive break below $1.38 the critical level to monitor for confirmation of further weakness.


-
 Afghanistan
-
 Albania
-
 Algeria
-
 Angola
-
 Argentina
-
 Armenia
-
 Australia
-
 Austria
-
 Azerbaijan
-
 Bahamas
-
 Bahrain
-
 Bangladesh
-
 Belarus
-
 Belgium
-
 Bolivia
-
 Botswana
-
 Brazil
-
 Brunei
-
 Bulgaria
-
 Cambodia
-
 Cameroon
-
 Canada
-
 Chile
Chile
-
 China
China
-
 Colombia
-
 Congo
Congo
-
 Costa Rica
-
 Cote d'Ivoire
-
 Croatia
-
 Cuba
Cuba
-
 Cyprus
-
 Czechia
-
 DR Congo
-
 Denmark
-
 Dominican Republic
-
 Ecuador
-
 Egypt
Egypt
-
 El Salvador
-
 Estonia
-
 Eswatini
-
 Ethiopia
-
 Finland
-
 France
-
 Georgia
-
 Germany
-
 Ghana
Ghana
-
 Greece
-
 Haiti
Haiti
-
 Hong Kong
-
 Hungary
-
 India
India
-
 Indonesia
-
 Iran, Islamic republic
-
 Iraq
Iraq
-
 Ireland
-
 Israel
-
 Italy
Italy
-
 Jamaica
-
 Japan
Japan
-
 Jordan
-
 Kazakhstan
-
 Kenya
Kenya
-
 Korea
Korea
-
 Kuwait
-
 Kyrgyzstan
-
 Laos
Laos
-
 Latvia
-
 Lebanon
-
 Lesotho
-
 Libya
Libya
-
 Lithuania
-
 Luxembourg
-
 Madagascar
-
 Malaysia
-
 Malta
Malta
-
 Mauritius
-
 Mexico
-
 Moldova
-
 Mongolia
-
 Montenegro
-
 Morocco
-
 Mozambique
-
 Myanmar
-
 Namibia
-
 Nepal
Nepal
-
 Netherlands
-
 New Zealand
-
 Nigeria
-
 North Macedonia
-
 Norway
-
 Oman
Oman
-
 Pakistan
-
 Palestine
-
 Panama
-
 Papua New Guinea
-
 Paraguay
-
 Peru
Peru
-
 Philippines
-
 Poland
-
 Portugal
-
 Puerto Rico
-
 Qatar
Qatar
-
 Reunion
-
 Romania
-
 Rwanda
-
 Saudi Arabia
-
 Serbia
-
 Singapore
-
 Slovakia
-
 Slovenia
-
 Somalia
-
 South Africa
-
 Spain
Spain
-
 Sri Lanka
-
 Sweden
-
 Switzerland
-
 Syria
Syria
-
 Taiwan
-
 Tajikistan
-
 Tanzania
-
 Thailand
-
 Trinidad and Tobago
-
 Tunisia
-
 Turkey
-
 UAE
UAE
-
 Uganda
-
 Ukraine
-
 United Kingdom
-
United States
-
 Uruguay
-
 Uzbekistan
-
 Venezuela
-
 Vietnam
-
 Yemen
Yemen
-
 Zambia
-
 Zimbabwe
- Forex
- Crypto
