
Sundial Growers stock trades down amid mild downward pressure within current range

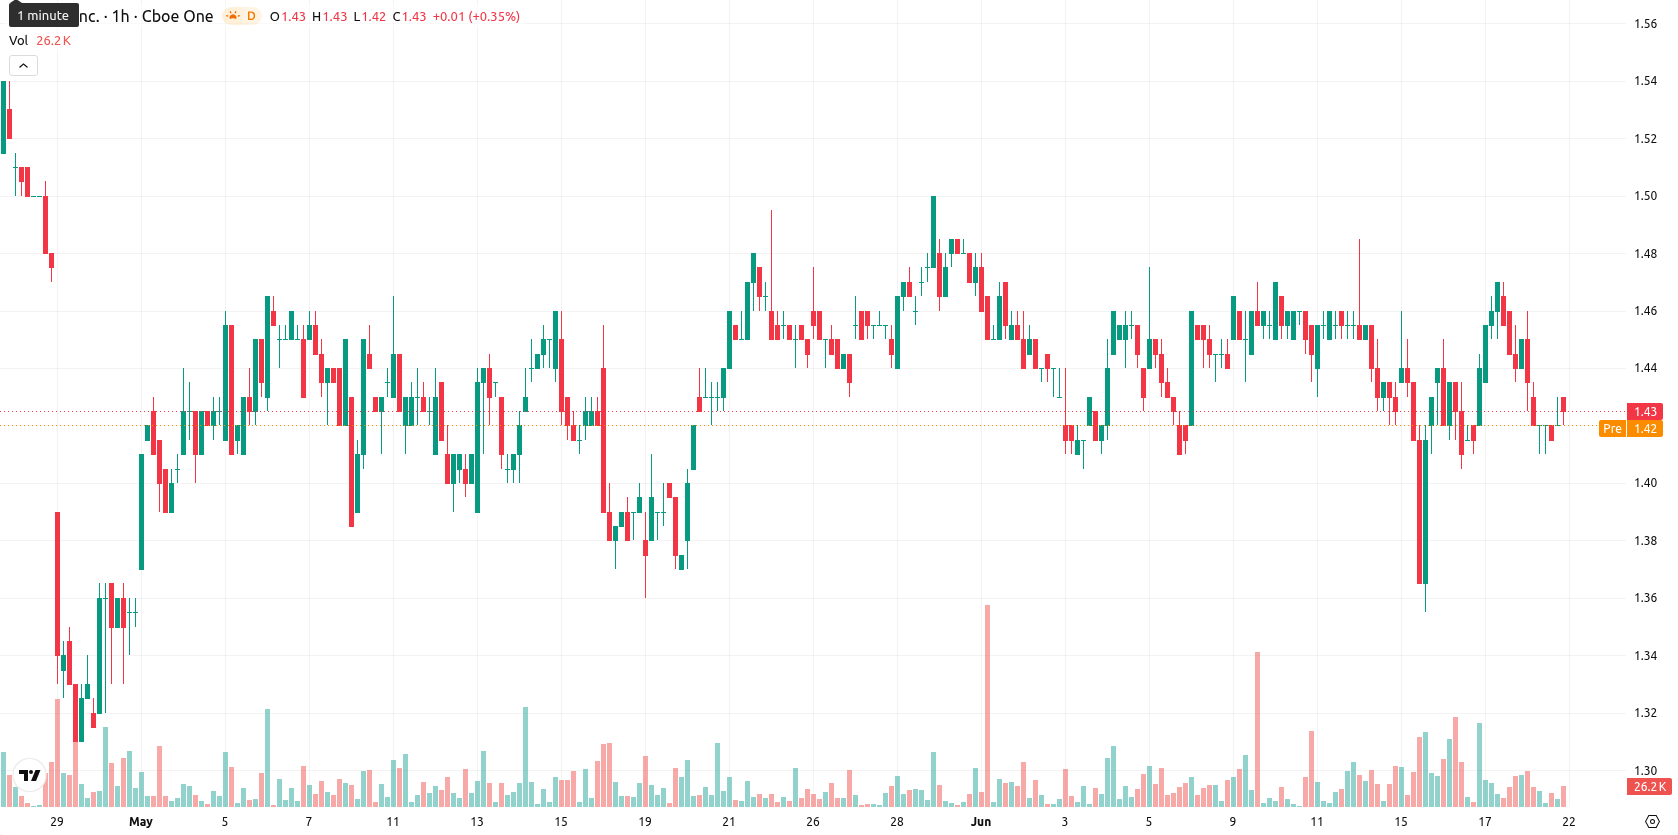
Sundial Growers Inc. (SNDL) stock is trading at $1.43 after a daily decline of 1.38%. The price is currently positioned above its key short-term moving averages, while remaining under pressure relative to medium- and long-term averages.
Highlights
- SNDL is experiencing short-term stabilization after slipping 1.38% intraday, but overall trend signals remain bearish.
- Price action is constrained between support at $1.41 and resistance at $1.48, with a neutral to weak downside bias.
- Technical indicators show weak momentum and mixed directionality, supporting a sideways to bearish outlook with expected range of $1.38–$1.48.
Mixed momentum as price straddles key technical boundaries
On the hourly chart, SNDL is trading above the MA-20 but remains below both the MA-50 and the daily MA-200, with the Ichimoku Kijun level at $1.41 acting as immediate support. Momentum indicators present mixed signals: MACD shows a sell reading, ADX is neutral, RSI is at 47.97 indicating a mild sell bias, while CCI and Stoch RSI are neutral, suggesting a lack of extreme conditions. BBP signals buyer dominance on an intraday basis, but the Awesome Oscillator remains neutral, underscoring the absence of a clear trend. The price action is currently mid-range and volatility appears moderate, aligning with the lack of decisive momentum in either direction.
Directional uncertainty as probabilities favor downside within range
In the short term, SNDL is expected to trade within a range between $1.38 and $1.48, reflecting its typical volatility band relative to current levels. There is a 42% probability of an upside move, while the probability of a continued decline is higher at 58%. The base case is for the stock to remain rangebound unless it breaks above the current resistance or falls below immediate support at $1.41, which would signal a shift toward a new directional phase.
Earlier, analysts noted that Sundial Growers’ price action was characterized by mixed momentum and a lack of directional conviction. This current analysis reinforces that cautious stance, indicating that monitoring for a decisive break above resistance or below support remains essential as the next catalyst for a sustained move.


-
 Afghanistan
-
 Albania
-
 Algeria
-
 Angola
-
 Argentina
-
 Armenia
-
 Australia
-
 Austria
-
 Azerbaijan
-
 Bahamas
-
 Bahrain
-
 Bangladesh
-
 Belarus
-
 Belgium
-
 Bolivia
-
 Botswana
-
 Brazil
-
 Brunei
-
 Bulgaria
-
 Cambodia
-
 Cameroon
-
 Canada
-
 Chile
Chile
-
 China
China
-
 Colombia
-
 Congo
Congo
-
 Costa Rica
-
 Cote d'Ivoire
-
 Croatia
-
 Cuba
Cuba
-
 Cyprus
-
 Czechia
-
 DR Congo
-
 Denmark
-
 Dominican Republic
-
 Ecuador
-
 Egypt
Egypt
-
 El Salvador
-
 Estonia
-
 Eswatini
-
 Ethiopia
-
 Finland
-
 France
-
 Georgia
-
 Germany
-
 Ghana
Ghana
-
 Greece
-
 Haiti
Haiti
-
 Hong Kong
-
 Hungary
-
 India
India
-
 Indonesia
-
 Iran, Islamic republic
-
 Iraq
Iraq
-
 Ireland
-
 Israel
-
 Italy
Italy
-
 Jamaica
-
 Japan
Japan
-
 Jordan
-
 Kazakhstan
-
 Kenya
Kenya
-
 Korea
Korea
-
 Kuwait
-
 Kyrgyzstan
-
 Laos
Laos
-
 Latvia
-
 Lebanon
-
 Lesotho
-
 Libya
Libya
-
 Lithuania
-
 Luxembourg
-
 Madagascar
-
 Malaysia
-
 Malta
Malta
-
 Mauritius
-
 Mexico
-
 Moldova
-
 Mongolia
-
 Montenegro
-
 Morocco
-
 Mozambique
-
 Myanmar
-
 Namibia
-
 Nepal
Nepal
-
 Netherlands
-
 New Zealand
-
 Nigeria
-
 North Macedonia
-
 Norway
-
 Oman
Oman
-
 Pakistan
-
 Palestine
-
 Panama
-
 Papua New Guinea
-
 Paraguay
-
 Peru
Peru
-
 Philippines
-
 Poland
-
 Portugal
-
 Puerto Rico
-
 Qatar
Qatar
-
 Reunion
-
 Romania
-
 Rwanda
-
 Saudi Arabia
-
 Serbia
-
 Singapore
-
 Slovakia
-
 Slovenia
-
 Somalia
-
 South Africa
-
 Spain
Spain
-
 Sri Lanka
-
 Sweden
-
 Switzerland
-
 Syria
Syria
-
 Taiwan
-
 Tajikistan
-
 Tanzania
-
 Thailand
-
 Trinidad and Tobago
-
 Tunisia
-
 Turkey
-
 UAE
UAE
-
 Uganda
-
 Ukraine
-
 United Kingdom
-
United States
-
 Uruguay
-
 Uzbekistan
-
 Venezuela
-
 Vietnam
-
 Yemen
Yemen
-
 Zambia
-
 Zimbabwe
- Forex
- Crypto
