


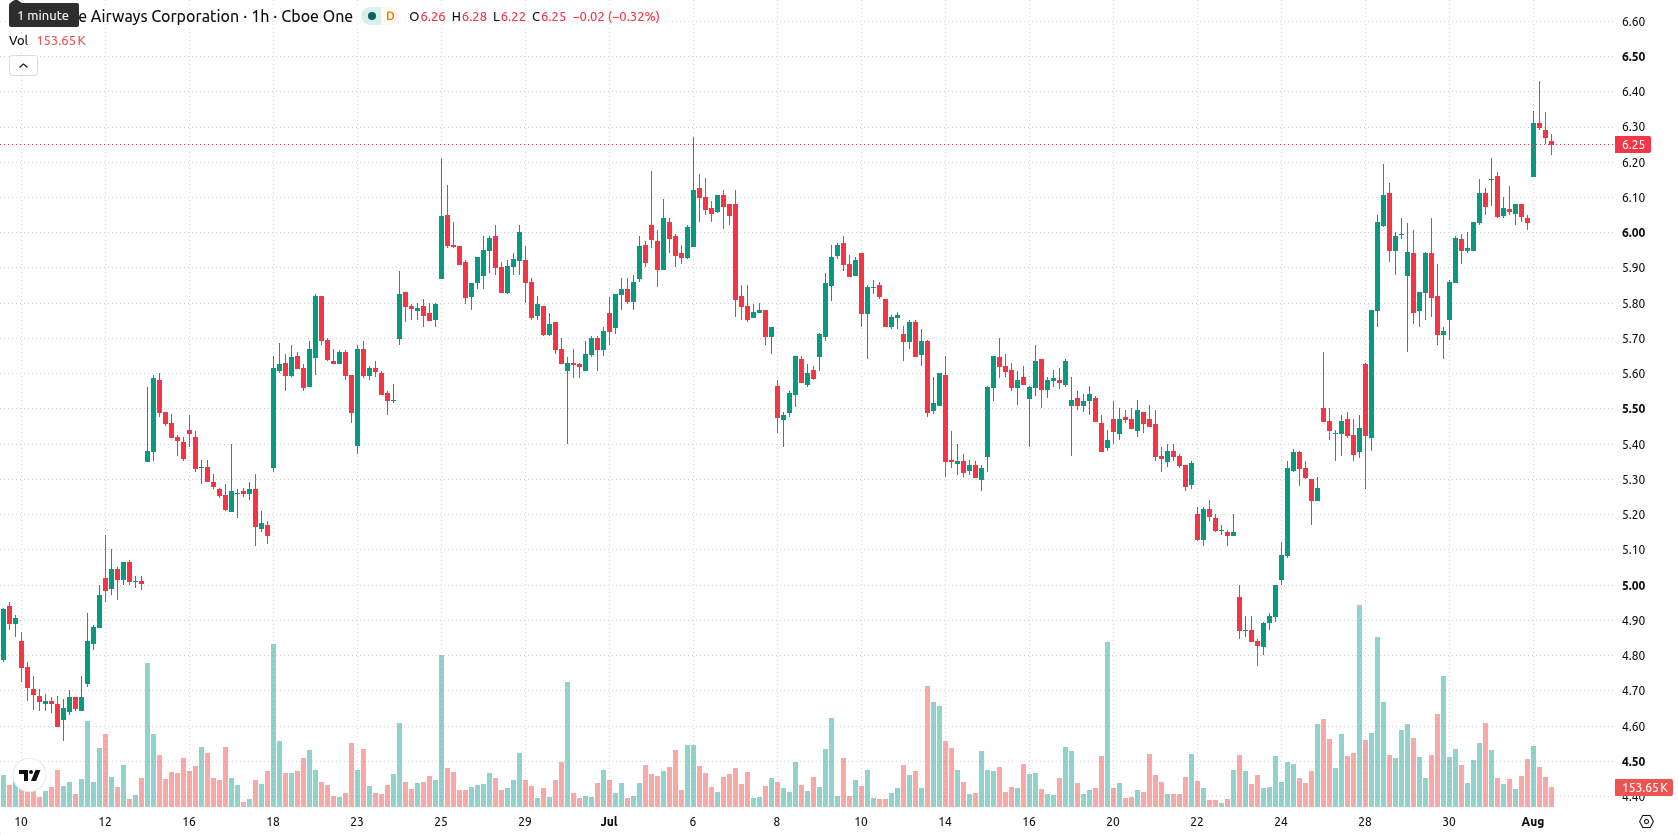
JetBlue Airways (JBLU) stock is trading at $6.26, advancing 3.81% on the day. The price remains above its key moving averages, signaling continued bullish momentum in the short and medium term.
 3.65
4.03
3.65
4.03
Highlights
- JetBlue Airways reported second-quarter 2026 operating revenue up 14.5% to $2.7 billion, driven by surging demand from its JetForward strategy.
- Disciplined cost control limited non-fuel unit cost growth to 2.4% year-over-year, enabling $470 million incremental EBIT through June 2026 and supporting confident full-year guidance reinstatement.
- JBLU exhibits a strong bullish technical structure with intraday momentum signals confirming buyer dominance and a high-probability price range of $5.85 to $6.67 in the near term.
Earnings beat and guidance boost as JetForward lifts expansion
JetBlue Airways delivered robust second-quarter 2026 earnings, with operating revenue rising 14.5% to $2.7 billion as the JetForward transformation strategy fueled significant demand gains. This outperformance was reinforced by disciplined cost management, which limited the increase in cost per available seat mile excluding fuel to just 2.4% year-over-year, surpassing internal guidance and highlighting operational efficiency. Management restored the full-year outlook, signaling strategic confidence, while cumulative incremental EBIT of $470 million was generated through June 2026 under the JetForward program, according to Aviationsourcenews.
Bullish momentum accelerates as buyers dominate amid volatility
On the H1 timeframe, JBLU is trading above the MA-20 at $6.05 and MA-50 at $5.72, with the daily MA-200 significantly lower at $4.99. The Ichimoku Kijun on the D1 stands at $6.03 as immediate support. Short-term momentum indicators remain strong: MACD and ADX both reflect ongoing bullish pressure, and the RSI at 65.62 is in buy territory. CCI sits in overbought territory, while Stochastic RSI is neutral. Bull/Bear Power and a positive Awesome Oscillator reading indicate continued buyer dominance, positioning price action firmly within an intraday high-volatility environment.
Rangebound outlook holds as breakout risks remain subdued
Looking ahead over the next two to three trading days, JBLU is forecast to consolidate within a range of $5.85 to $6.67, reflecting typical volatility around current levels. The baseline scenario anticipates continued stability in this corridor. A bullish breakout above $6.67 would signal further upside potential, whereas a sustained drop below immediate support at $6.03 could open the door to deeper pullbacks, though this outcome is currently seen as very low probability.
In a recent review, analysts highlighted JetBlue Airways’ strong revenue performance and persistent bullish momentum despite ongoing cost pressures. The latest earnings results and technical signals reinforce this constructive outlook, with current conditions suggesting traders should monitor for a potential breakout above $6.67 as the next catalyst for upside.









-
 Afghanistan
-
 Albania
-
 Algeria
-
 Angola
-
 Argentina
-
 Armenia
-
 Australia
-
 Austria
-
 Azerbaijan
-
 Bahamas
-
 Bahrain
-
 Bangladesh
-
 Belarus
-
 Belgium
-
 Bolivia
-
 Botswana
-
 Brazil
-
 Brunei
-
 Bulgaria
-
 Cambodia
-
 Cameroon
-
 Canada
-
 Chile
Chile
-
 China
China
-
 Colombia
-
 Congo
Congo
-
 Costa Rica
-
 Cote d'Ivoire
-
 Croatia
-
 Cuba
Cuba
-
 Cyprus
-
 Czechia
-
 DR Congo
-
 Denmark
-
 Dominican Republic
-
 Ecuador
-
 Egypt
Egypt
-
 El Salvador
-
 Estonia
-
 Eswatini
-
 Ethiopia
-
 Finland
-
 France
-
 Georgia
-
 Germany
-
 Ghana
Ghana
-
 Greece
-
 Haiti
Haiti
-
 Hong Kong
-
 Hungary
-
 India
India
-
 Indonesia
-
 Iran, Islamic republic
-
 Iraq
Iraq
-
 Ireland
-
 Israel
-
 Italy
Italy
-
 Jamaica
-
 Japan
Japan
-
 Jordan
-
 Kazakhstan
-
 Kenya
Kenya
-
 Korea
Korea
-
 Kuwait
-
 Kyrgyzstan
-
 Laos
Laos
-
 Latvia
-
 Lebanon
-
 Lesotho
-
 Libya
Libya
-
 Lithuania
-
 Luxembourg
-
 Madagascar
-
 Malaysia
-
 Malta
Malta
-
 Mauritius
-
 Mexico
-
 Moldova
-
 Mongolia
-
 Montenegro
-
 Morocco
-
 Mozambique
-
 Myanmar
-
 Namibia
-
 Nepal
Nepal
-
 Netherlands
-
 New Zealand
-
 Nigeria
-
 North Macedonia
-
 Norway
-
 Oman
Oman
-
 Pakistan
-
 Palestine
-
 Panama
-
 Papua New Guinea
-
 Paraguay
-
 Peru
Peru
-
 Philippines
-
 Poland
-
 Portugal
-
 Puerto Rico
-
 Qatar
Qatar
-
 Reunion
-
 Romania
-
 Rwanda
-
 Saudi Arabia
-
 Serbia
-
 Singapore
-
 Slovakia
-
 Slovenia
-
 Somalia
-
 South Africa
-
 Spain
Spain
-
 Sri Lanka
-
 Sweden
-
 Switzerland
-
 Syria
Syria
-
 Taiwan
-
 Tajikistan
-
 Tanzania
-
 Thailand
-
 Trinidad and Tobago
-
 Tunisia
-
 Turkey
-
 UAE
UAE
-
 Uganda
-
 Ukraine
-
 United Kingdom
-
United States
-
 Uruguay
-
 Uzbekistan
-
 Venezuela
-
 Vietnam
-
 Yemen
Yemen
-
 Zambia
-
 Zimbabwe
- Forex
- Crypto












