

UnitedHealth stock tests support at $397.8 as downside pressures linger: weekly analysis

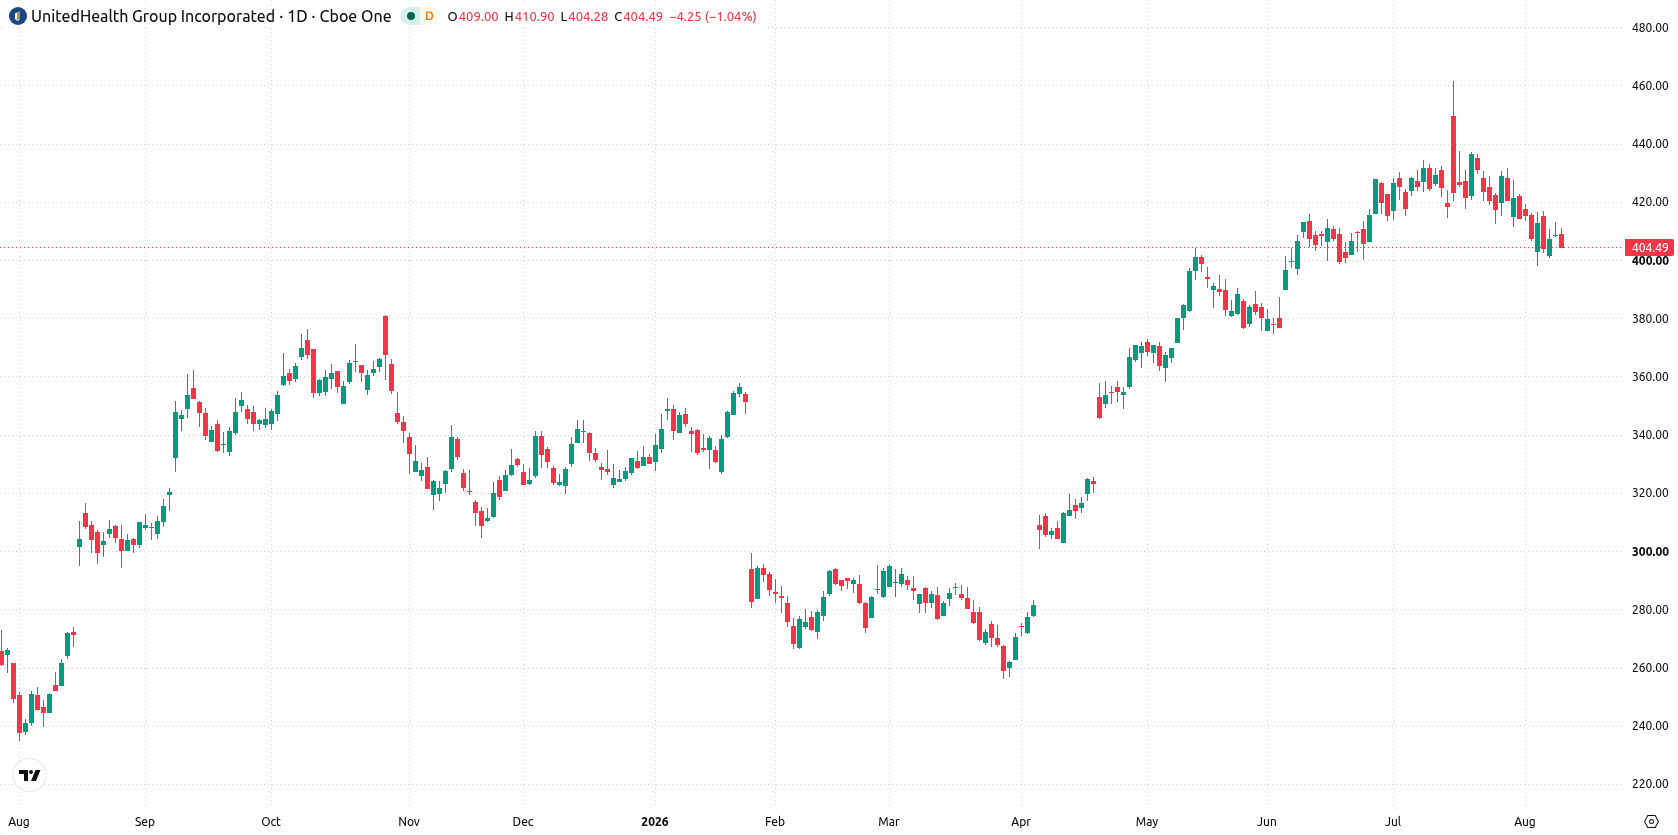
Shares of UnitedHealth Group (UNH) are trading near $404 as a declining trend continues to push into oversold territory. The daily chart shows building downside momentum, but sell signals are not yet universally confirmed — leaving the market searching for direction as traders debate whether recent weakness has run its course.
 399.88
399.88
399.88
Highlights
- Shares of UnitedHealth fell to $403.77 this week, slipping below key short-term averages while holding above the long-term level.
- Technical indicators show a developing downside trend with MACD and ADX at sell signals and momentum yet to confirm further direction.
- Shares are projected to trade between $395.19 and $436.26 next week, with resistance at $413.18 and support at $397.8.
Upbeat outlook as robust results and guidance upgrade lift sentiment
UnitedHealth posted its second-quarter 2026 results, revealing stronger-than-expected revenue and earnings for the period ended June 30, 2026, according to filing details from kalkinemedia.com and the Securities and Exchange Commission. As a result, the company raised its full-year adjusted EPS guidance to $19.50–$20.00, according to Yahoo Finance and Quiver Quantitative. News from Yahoo Finance and Simply Wall St also highlighted UnitedHealth's $4 million pledge through the United Health Foundation to triple the University of Tennessee Health Sciences’ health hub network by the end of 2027, while State Street disclosed a 5% stake in UNH in a recent SEC filing.
Weakening technical setup as signals diverge and volatility persists over the week
The daily chart structure features a developing trend, with momentum characterized by an emerging move lower that is not yet confirmed. MACD and ADX both signal sell, while RSI holds in the neutral zone at 45.37, pointing to a lack of clear conviction. With volatility over the past week at 4.82%, the stock currently finds support at $397.8 and faces resistance at $413.18, with the Ichimoku Kijun at $429.71 also acting as a barrier. This positioning suggests downside pressures are building, but a decisive move is still awaited.
Range-bound trade expected next week amid downside risks and breakout potential
Next week, UnitedHealth is expected to trade between $395.19 and $436.26, with a 55% probability of a decrease and 45% for an increase. The base case keeps the stock ranging between support at $397.8 and resistance at $413.18. A bullish scenario unfolds if shares move decisively above $413.18 toward the upper boundary of the expected range. Conversely, a drop below $397.8 would open up further downside risk within the forecasted levels.
Earlier, analysts noted that healthcare’s relative strength and robust earnings prospects were driving increased interest and sector rotation on Wall Street. UnitedHealth’s recent earnings beat and higher full-year guidance reinforce this narrative, but with technical pressure mounting, traders should monitor for a confirmed break above $413.18 or below $397.8 to determine the stock’s next direction.





Latest UnitedHealth News





-
 Afghanistan
-
 Albania
-
 Algeria
-
 Angola
-
 Argentina
-
 Armenia
-
 Australia
-
 Austria
-
 Azerbaijan
-
 Bahamas
-
 Bahrain
-
 Bangladesh
-
 Belarus
-
 Belgium
-
 Bolivia
-
 Botswana
-
 Brazil
-
 Brunei
-
 Bulgaria
-
 Cambodia
-
 Cameroon
-
 Canada
-
 Chile
Chile
-
 China
China
-
 Colombia
-
 Congo
Congo
-
 Costa Rica
-
 Cote d'Ivoire
-
 Croatia
-
 Cuba
Cuba
-
 Cyprus
-
 Czechia
-
 DR Congo
-
 Denmark
-
 Dominican Republic
-
 Ecuador
-
 Egypt
Egypt
-
 El Salvador
-
 Estonia
-
 Eswatini
-
 Ethiopia
-
 Finland
-
 France
-
 Georgia
-
 Germany
-
 Ghana
Ghana
-
 Greece
-
 Haiti
Haiti
-
 Hong Kong
-
 Hungary
-
 India
India
-
 Indonesia
-
 Iran, Islamic republic
-
 Iraq
Iraq
-
 Ireland
-
 Israel
-
 Italy
Italy
-
 Jamaica
-
 Japan
Japan
-
 Jordan
-
 Kazakhstan
-
 Kenya
Kenya
-
 Korea
Korea
-
 Kuwait
-
 Kyrgyzstan
-
 Laos
Laos
-
 Latvia
-
 Lebanon
-
 Lesotho
-
 Libya
Libya
-
 Lithuania
-
 Luxembourg
-
 Madagascar
-
 Malaysia
-
 Malta
Malta
-
 Mauritius
-
 Mexico
-
 Moldova
-
 Mongolia
-
 Montenegro
-
 Morocco
-
 Mozambique
-
 Myanmar
-
 Namibia
-
 Nepal
Nepal
-
 Netherlands
-
 New Zealand
-
 Nigeria
-
 North Macedonia
-
 Norway
-
 Oman
Oman
-
 Pakistan
-
 Palestine
-
 Panama
-
 Papua New Guinea
-
 Paraguay
-
 Peru
Peru
-
 Philippines
-
 Poland
-
 Portugal
-
 Puerto Rico
-
 Qatar
Qatar
-
 Reunion
-
 Romania
-
 Rwanda
-
 Saudi Arabia
-
 Serbia
-
 Singapore
-
 Slovakia
-
 Slovenia
-
 Somalia
-
 South Africa
-
 Spain
Spain
-
 Sri Lanka
-
 Sweden
-
 Switzerland
-
 Syria
Syria
-
 Taiwan
-
 Tajikistan
-
 Tanzania
-
 Thailand
-
 Trinidad and Tobago
-
 Tunisia
-
 Turkey
-
 UAE
UAE
-
 Uganda
-
 Ukraine
-
 United Kingdom
-
United States
-
 Uruguay
-
 Uzbekistan
-
 Venezuela
-
 Vietnam
-
 Yemen
Yemen
-
 Zambia
-
 Zimbabwe
- Forex
- Crypto












