

Interactive Brokers stock rally gains traction as buyers overwhelm sellers

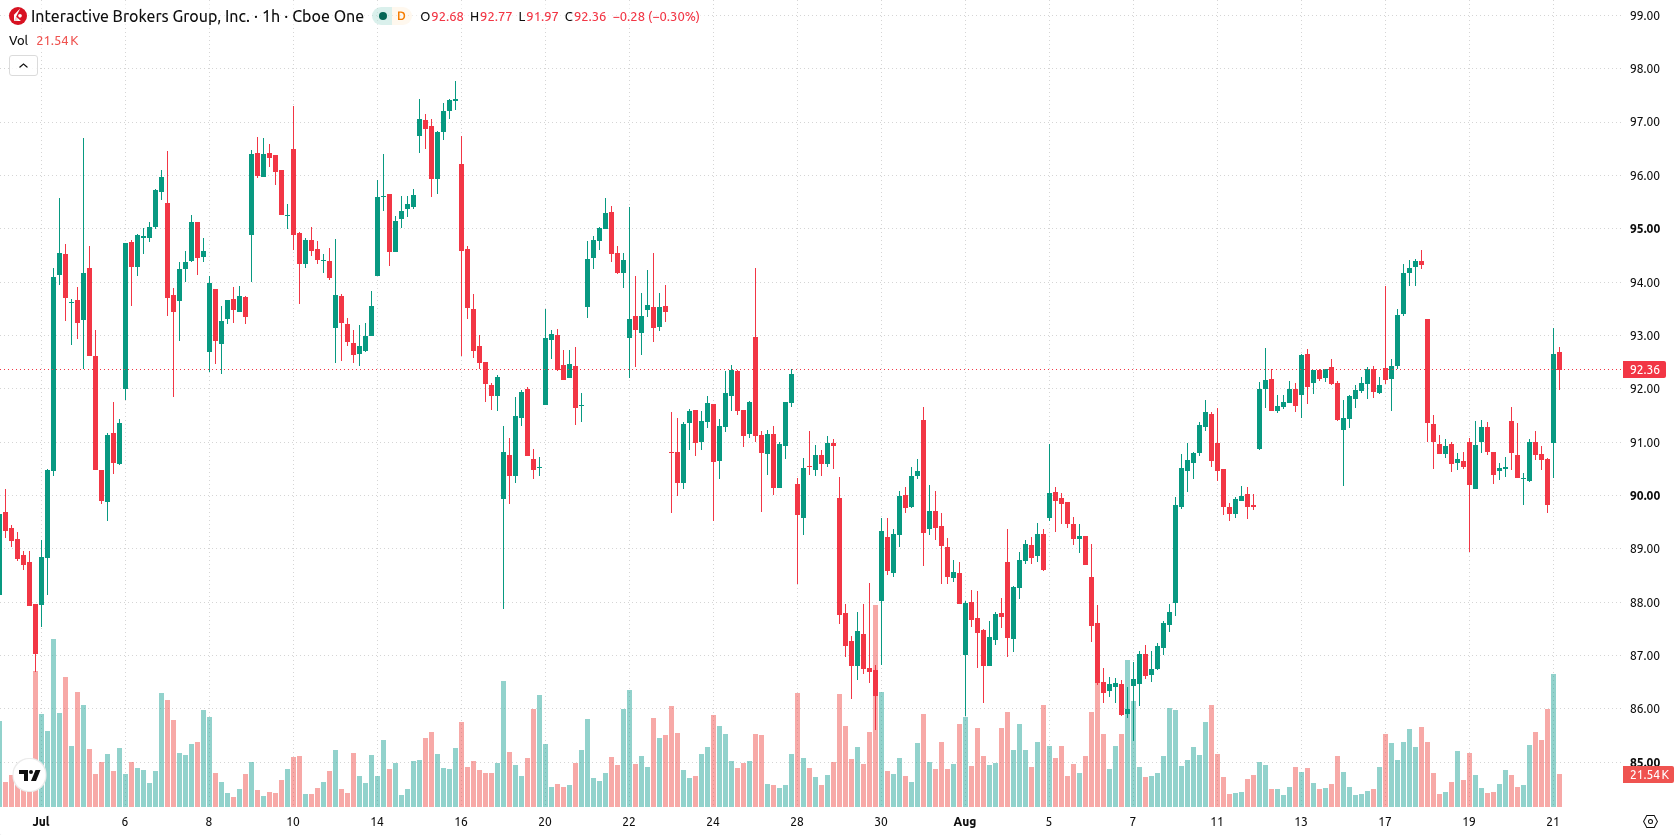
Interactive Brokers (IBKR) stock is trading at $92.09, up 2.49% on the day. The price currently sits above its key moving averages, suggesting underlying strength after today's upward move.
 88.11
89.11
88.11
89.11
Highlights
- IBKR/USD maintains a bullish structure on multiple timeframes as it trades above key moving averages.
- Momentum indicators are mixed with several signaling overbought conditions and intraday buyer control despite conflicting oscillator readings.
- Price closed at $92.09, up 2.49% on the day, with the next 2 to 3 days likely to see consolidation between $89.55 and $94.63.
Momentum divergence as overbought signals clash with neutral oscillators
On the technical side, IBKR is trading above its MA-20 at $90.72 and MA-50 at $91.67 on the hourly chart, and remains well above the MA-200 at $77.55 on the daily timeframe. The Ichimoku Kijun at $91.76 is acting as immediate support. RSI is at 60.7, indicating moderate strength, while MACD signals a strong sell and ADX remains neutral, highlighting a divergence. Stoch RSI, CCI, and Bull/Bear Power all reflect overbought conditions with buyers dominating, as the Awesome Oscillator remains neutral.
Range-bound scenario as upside breakout gains probability
For the next 2–3 trading days, IBKR is expected to trade within a volatility band ranging from $89.55 to $94.63. The probability of continued upward movement is estimated at 71%, while a down move is less likely at 29%. The baseline scenario sees price consolidating within the stated range; a bullish scenario would feature a break above resistance toward the upper forecast limit, while a bearish scenario could see IBKR slip below immediate support near the Kijun and test the lower band.
Earlier, analysts noted that Interactive Brokers was experiencing selling pressure but maintained an overall constructive outlook as the company expanded its client services. The current analysis signals a shift toward short-term strength, with traders advised to watch for a sustained move above or below the current volatility band of $89.55 to $94.63 for directional confirmation.





Latest Interactive Brokers News





-
 Afghanistan
-
 Albania
-
 Algeria
-
 Angola
-
 Argentina
-
 Armenia
-
 Australia
-
 Austria
-
 Azerbaijan
-
 Bahamas
-
 Bahrain
-
 Bangladesh
-
 Belarus
-
 Belgium
-
 Bolivia
-
 Botswana
-
 Brazil
-
 Brunei
-
 Bulgaria
-
 Cambodia
-
 Cameroon
-
 Canada
-
 Chile
Chile
-
 China
China
-
 Colombia
-
 Congo
Congo
-
 Costa Rica
-
 Cote d'Ivoire
-
 Croatia
-
 Cuba
Cuba
-
 Cyprus
-
 Czechia
-
 DR Congo
-
 Denmark
-
 Dominican Republic
-
 Ecuador
-
 Egypt
Egypt
-
 El Salvador
-
 Estonia
-
 Eswatini
-
 Ethiopia
-
 Finland
-
 France
-
 Georgia
-
 Germany
-
 Ghana
Ghana
-
 Greece
-
 Haiti
Haiti
-
 Hong Kong
-
 Hungary
-
 India
India
-
 Indonesia
-
 Iran, Islamic republic
-
 Iraq
Iraq
-
 Ireland
-
 Israel
-
 Italy
Italy
-
 Jamaica
-
 Japan
Japan
-
 Jordan
-
 Kazakhstan
-
 Kenya
Kenya
-
 Korea
Korea
-
 Kuwait
-
 Kyrgyzstan
-
 Laos
Laos
-
 Latvia
-
 Lebanon
-
 Lesotho
-
 Libya
Libya
-
 Lithuania
-
 Luxembourg
-
 Madagascar
-
 Malaysia
-
 Malta
Malta
-
 Mauritius
-
 Mexico
-
 Moldova
-
 Mongolia
-
 Montenegro
-
 Morocco
-
 Mozambique
-
 Myanmar
-
 Namibia
-
 Nepal
Nepal
-
 Netherlands
-
 New Zealand
-
 Nigeria
-
 North Macedonia
-
 Norway
-
 Oman
Oman
-
 Pakistan
-
 Palestine
-
 Panama
-
 Papua New Guinea
-
 Paraguay
-
 Peru
Peru
-
 Philippines
-
 Poland
-
 Portugal
-
 Puerto Rico
-
 Qatar
Qatar
-
 Reunion
-
 Romania
-
 Rwanda
-
 Saudi Arabia
-
 Serbia
-
 Singapore
-
 Slovakia
-
 Slovenia
-
 Somalia
-
 South Africa
-
 Spain
Spain
-
 Sri Lanka
-
 Sweden
-
 Switzerland
-
 Syria
Syria
-
 Taiwan
-
 Tajikistan
-
 Tanzania
-
 Thailand
-
 Trinidad and Tobago
-
 Tunisia
-
 Turkey
-
 UAE
UAE
-
 Uganda
-
 Ukraine
-
 United Kingdom
-
United States
-
 Uruguay
-
 Uzbekistan
-
 Venezuela
-
 Vietnam
-
 Yemen
Yemen
-
 Zambia
-
 Zimbabwe
- Forex
- Crypto












