

Why is Interactive Brokers stock up 2.9% today?

Interactive Brokers Group, Inc. (IBKR) advanced 2.93% today as bullish technical momentum drove a move toward session highs. The uptrend is supported by the stock's position above all major moving averages, though mixed momentum signals and overbought warnings could limit further gains.
 89.11
91.81
89.11
91.81
Highlights
- Interactive Brokers stock trades above key short-, medium-, and long-term moving averages, confirming overall bullish trend structure.
- Momentum indicators are mixed with intraday conditions overbought and neutral oscillators, indicating lack of trend consensus.
- The expected five-day trading range is $89.64 to $95.51 with a 32% chance of a breakout higher and baseline consolidation near current levels.
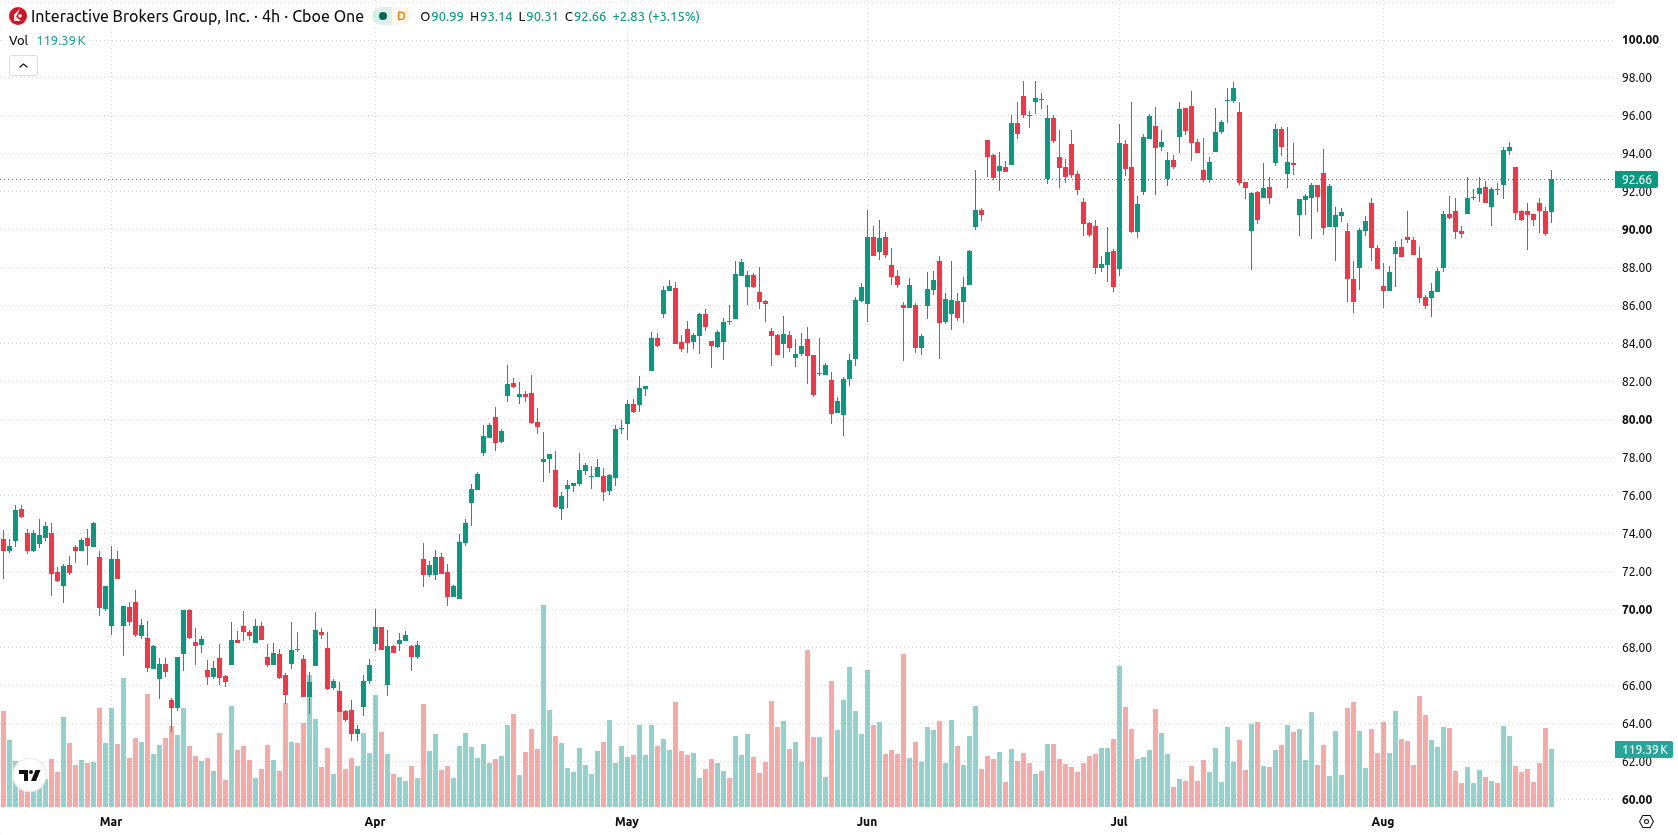
Support holds as mixed momentum signals pose durability questions
IBKR is trading above its 20-day, 50-day, and 200-day moving averages ($89.97, $91.63, and $77.55, respectively), confirming bullish momentum in the short, medium, and long term. There is immediate resistance at $93.05 and support at $91.63, with a broader bullish alignment between the 50-day and 200-day averages. Momentum indicators are mixed: MACD and ADX remain neutral, while RSI stands at 48.07 in neutral territory and flashes a sell signal. Stochastic RSI, CCI, and MACD remain neutral, and Bull/Bear Power (BBP) at 0.92 signals buyers dominate intraday momentum but also warns of short-term overbought conditions. The stock closed near session highs after an upside gap, with intraday volatility at 3.03%. Divergence between oscillators and momentum signals highlights a lack of consensus on trend durability.
Earlier, analysts noted that Interactive Brokers was exhibiting short-term technical strength within a consolidation phase, supported by its position above key moving averages. The latest data highlight a shift in momentum signals and increased volatility, suggesting that traders should closely monitor $91.63 as an immediate support level for potential downside risk.





Latest Interactive Brokers News




-
 Afghanistan
-
 Albania
-
 Algeria
-
 Angola
-
 Argentina
-
 Armenia
-
 Australia
-
 Austria
-
 Azerbaijan
-
 Bahamas
-
 Bahrain
-
 Bangladesh
-
 Belarus
-
 Belgium
-
 Bolivia
-
 Botswana
-
 Brazil
-
 Brunei
-
 Bulgaria
-
 Cambodia
-
 Cameroon
-
 Canada
-
 Chile
Chile
-
 China
China
-
 Colombia
-
 Congo
Congo
-
 Costa Rica
-
 Cote d'Ivoire
-
 Croatia
-
 Cuba
Cuba
-
 Cyprus
-
 Czechia
-
 DR Congo
-
 Denmark
-
 Dominican Republic
-
 Ecuador
-
 Egypt
Egypt
-
 El Salvador
-
 Estonia
-
 Eswatini
-
 Ethiopia
-
 Finland
-
 France
-
 Georgia
-
 Germany
-
 Ghana
Ghana
-
 Greece
-
 Haiti
Haiti
-
 Hong Kong
-
 Hungary
-
 India
India
-
 Indonesia
-
 Iran, Islamic republic
-
 Iraq
Iraq
-
 Ireland
-
 Israel
-
 Italy
Italy
-
 Jamaica
-
 Japan
Japan
-
 Jordan
-
 Kazakhstan
-
 Kenya
Kenya
-
 Korea
Korea
-
 Kuwait
-
 Kyrgyzstan
-
 Laos
Laos
-
 Latvia
-
 Lebanon
-
 Lesotho
-
 Libya
Libya
-
 Lithuania
-
 Luxembourg
-
 Madagascar
-
 Malaysia
-
 Malta
Malta
-
 Mauritius
-
 Mexico
-
 Moldova
-
 Mongolia
-
 Montenegro
-
 Morocco
-
 Mozambique
-
 Myanmar
-
 Namibia
-
 Nepal
Nepal
-
 Netherlands
-
 New Zealand
-
 Nigeria
-
 North Macedonia
-
 Norway
-
 Oman
Oman
-
 Pakistan
-
 Palestine
-
 Panama
-
 Papua New Guinea
-
 Paraguay
-
 Peru
Peru
-
 Philippines
-
 Poland
-
 Portugal
-
 Puerto Rico
-
 Qatar
Qatar
-
 Reunion
-
 Romania
-
 Rwanda
-
 Saudi Arabia
-
 Serbia
-
 Singapore
-
 Slovakia
-
 Slovenia
-
 Somalia
-
 South Africa
-
 Spain
Spain
-
 Sri Lanka
-
 Sweden
-
 Switzerland
-
 Syria
Syria
-
 Taiwan
-
 Tajikistan
-
 Tanzania
-
 Thailand
-
 Trinidad and Tobago
-
 Tunisia
-
 Turkey
-
 UAE
UAE
-
 Uganda
-
 Ukraine
-
 United Kingdom
-
United States
-
 Uruguay
-
 Uzbekistan
-
 Venezuela
-
 Vietnam
-
 Yemen
Yemen
-
 Zambia
-
 Zimbabwe
- Forex
- Crypto












