


SNDL Inc. (SNDL) stock is trading at $1.36 with a slight decline on the day, reflecting moderate volatility and remaining mid-range intraday. The share price sits above its main short-term moving average, but below key intermediate and long-term averages.
 1.18
1.26
1.18
1.26
Highlights
- SNDL stock trades above short-term but below medium- and long-term moving averages, suggesting persistent bearish pressure beyond the near term.
- Mixed momentum signals show oscillators favoring buyers, while ADX and Awesome Oscillator present a neutral trend outlook.
- SNDL stock is likely to consolidate between $1.33 and $1.39 over the next 2 to 3 sessions, with a 62% probability of upward movement.
Mixed momentum as bullish signals meet medium-term resistance
SNDL is trading above the MA-20, indicating short-term technical support, but remains below both the MA-50 and MA-200, pointing to medium- and long-term resistance. The Ichimoku Kijun line at $1.35 serves as immediate support. Momentum signals are mixed: MACD leans bullish and ADX is neutral, while RSI and CCI give buy signals and Stochastic RSI displays strong buy conditions. Bull/Bear Power confirms strong buyer presence, but the Awesome Oscillator is neutral, highlighting divergent momentum cues.
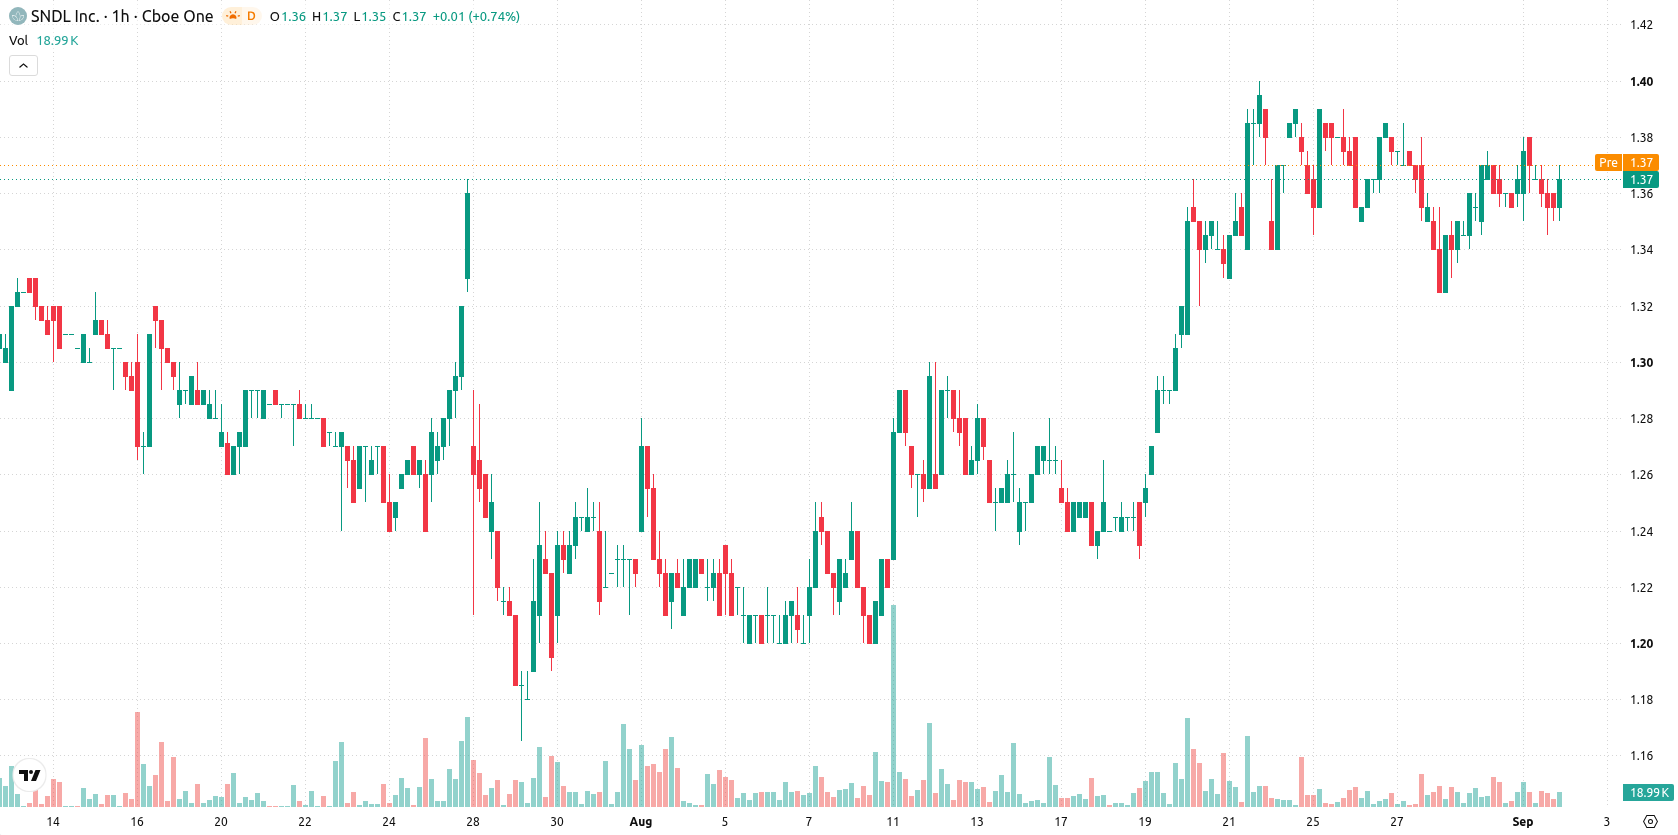
Consolidation likely as upside odds counter volatility risk
In the short term, SNDL is expected to oscillate between $1.33 and $1.39, reflecting typical volatility for the current trading range. The probability of an upward scenario stands at 62%, with a lower 38% chance of a short-term decline. The baseline forecast is continued price consolidation within this corridor, while a break above $1.39 resistance points to bullish momentum and a drop below $1.35 signals risk of additional downside.
Earlier, analysts noted that SNDL faced technical consolidation with the potential for limited upside while monitoring key breakout levels. The current analysis builds on this by highlighting a moderately bullish technical profile, with particular attention warranted at the $1.39 resistance level as a potential catalyst for further gains.








-
 Afghanistan
-
 Albania
-
 Algeria
-
 Angola
-
 Argentina
-
 Armenia
-
 Australia
-
 Austria
-
 Azerbaijan
-
 Bahamas
-
 Bahrain
-
 Bangladesh
-
 Belarus
-
 Belgium
-
 Bolivia
-
 Botswana
-
 Brazil
-
 Brunei
-
 Bulgaria
-
 Cambodia
-
 Cameroon
-
 Canada
-
 Chile
Chile
-
 China
China
-
 Colombia
-
 Congo
Congo
-
 Costa Rica
-
 Cote d'Ivoire
-
 Croatia
-
 Cuba
Cuba
-
 Cyprus
-
 Czechia
-
 DR Congo
-
 Denmark
-
 Dominican Republic
-
 Ecuador
-
 Egypt
Egypt
-
 El Salvador
-
 Estonia
-
 Eswatini
-
 Ethiopia
-
 Finland
-
 France
-
 Georgia
-
 Germany
-
 Ghana
Ghana
-
 Greece
-
 Haiti
Haiti
-
 Hong Kong
-
 Hungary
-
 India
India
-
 Indonesia
-
 Iran, Islamic republic
-
 Iraq
Iraq
-
 Ireland
-
 Israel
-
 Italy
Italy
-
 Jamaica
-
 Japan
Japan
-
 Jordan
-
 Kazakhstan
-
 Kenya
Kenya
-
 Korea
Korea
-
 Kuwait
-
 Kyrgyzstan
-
 Laos
Laos
-
 Latvia
-
 Lebanon
-
 Lesotho
-
 Libya
Libya
-
 Lithuania
-
 Luxembourg
-
 Madagascar
-
 Malaysia
-
 Malta
Malta
-
 Mauritius
-
 Mexico
-
 Moldova
-
 Mongolia
-
 Montenegro
-
 Morocco
-
 Mozambique
-
 Myanmar
-
 Namibia
-
 Nepal
Nepal
-
 Netherlands
-
 New Zealand
-
 Nigeria
-
 North Macedonia
-
 Norway
-
 Oman
Oman
-
 Pakistan
-
 Palestine
-
 Panama
-
 Papua New Guinea
-
 Paraguay
-
 Peru
Peru
-
 Philippines
-
 Poland
-
 Portugal
-
 Puerto Rico
-
 Qatar
Qatar
-
 Reunion
-
 Romania
-
 Rwanda
-
 Saudi Arabia
-
 Serbia
-
 Singapore
-
 Slovakia
-
 Slovenia
-
 Somalia
-
 South Africa
-
 Spain
Spain
-
 Sri Lanka
-
 Sweden
-
 Switzerland
-
 Syria
Syria
-
 Taiwan
-
 Tajikistan
-
 Tanzania
-
 Thailand
-
 Trinidad and Tobago
-
 Tunisia
-
 Turkey
-
 UAE
UAE
-
 Uganda
-
 Ukraine
-
 United Kingdom
-
United States
-
 Uruguay
-
 Uzbekistan
-
 Venezuela
-
 Vietnam
-
 Yemen
Yemen
-
 Zambia
-
 Zimbabwe
- Forex
- Crypto












