

Amazon stock remains pinned near recent lows as 200-day support comes into focus: weekly analysis

Shares of Amazon.com, Inc. (AMZN) are trading near $249 after a pullback of just over 2% this week, as buyers struggled to regain control in the face of mixed momentum signals. The chart shows price action pinned to the lower edge of the recent range, setting up a cautious week ahead as conflicting technicals keep direction uncertain.
 255.23
262.81
255.23
262.81
Highlights
- Shares of Amazon closed at $248.59, falling 2.1% over the past 7 days and trading below key moving averages.
- The stock is consolidating near the lower end of its weekly range with mixed momentum signals and contained volatility.
- Support is at $240.52 and resistance at $249.28, with a base case for consolidation between $244.02 and $249.28 next week.
Bond sale and AWS growth fuel sentiment despite cash flow pressures
Amazon completed its first-ever sterling bond sale of £4.25 billion (about $5.76 billion) on September 9, 2026, with investor interest reaching more than 2.5 times the amount raised, according to Reuters as cited by Yahoo Finance. Continued strong growth in AWS revenue and ongoing investments in artificial intelligence infrastructure are driving strategic focus into the coming week. Secondary factors include rising capital expenditures reducing free cash flow, a new Oxford Economics study on Amazon's U.S. energy projects, and expansion plans for its same-day fulfillment network.
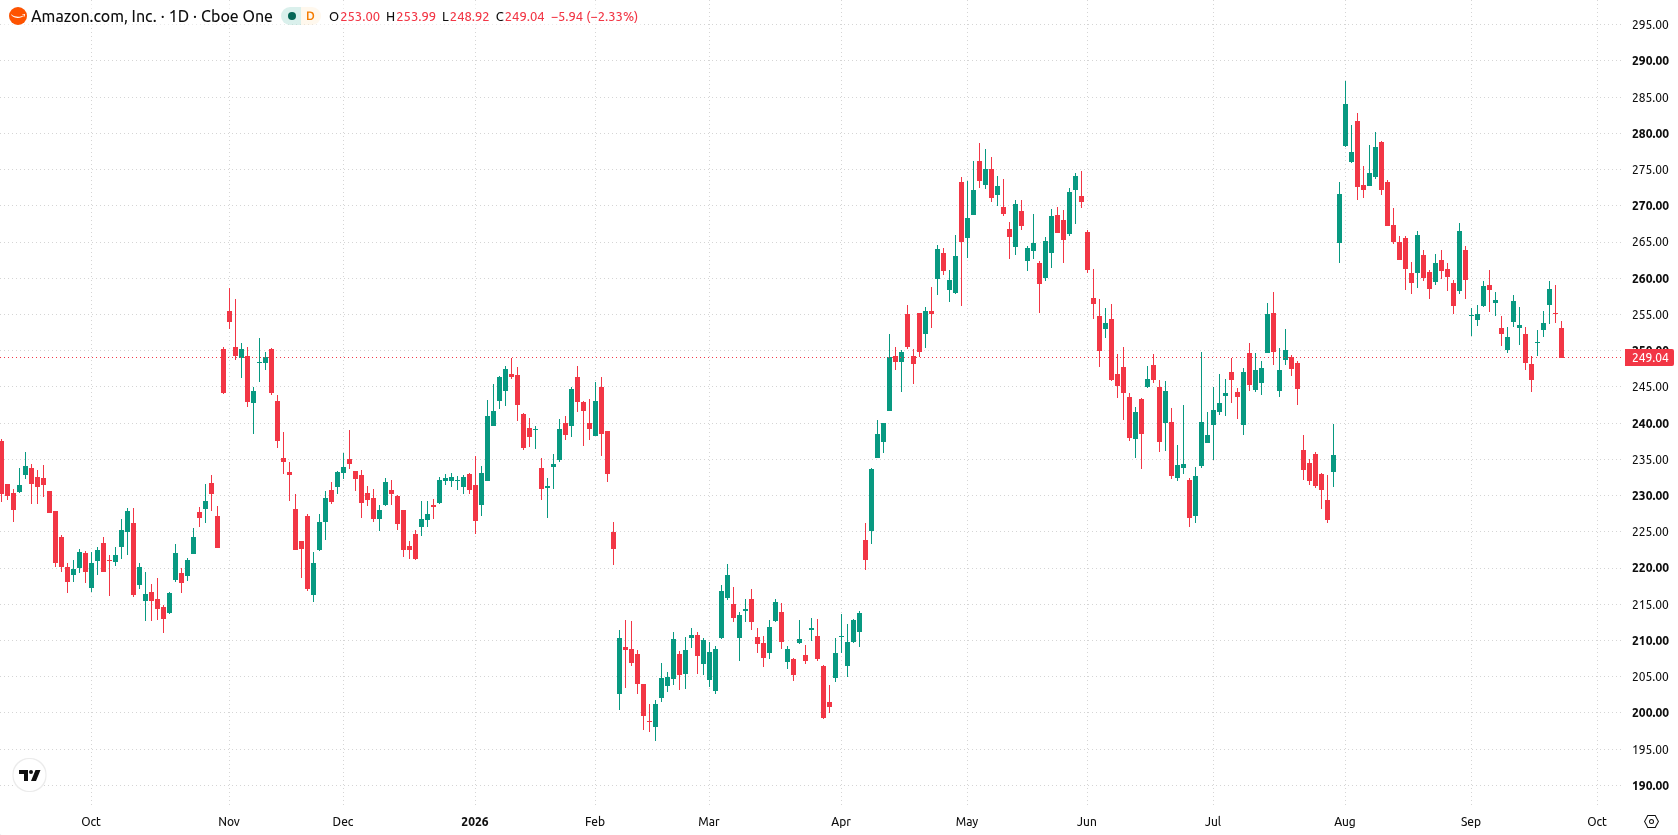
Technical resistance firms as momentum softens near support zone
On the daily chart, the structure shows Amazon stock pinned near the lower end of its weekly range, facing resistance at $249.28 and with the Ichimoku Kijun at $255.83 acting as a ceiling. Momentum is mixed, with MACD signaling "Strong Sell" at -1.69, while Stochastic RSI reads 73.72 and is approaching overbought territory. Volatility over the past 7 days was 4.1%, with momentum characterized as a contained move within a narrow range. Immediate support is found at the 200-day average of $240.52, while resistance is seen at the recent weekly low of $249.28.
Bearish outlook favored as range-bound moves dominate forecasts
Next week, the expected range spans $244.02 to $261.73, with a 43% probability of an increase and a 57% probability of a decrease. Most signals lean bearish, but there is still some potential for upside moves. The base case is a continued consolidation between $244.02 support and $249.28 resistance. A sustained push above $249.28 would target the upper range near $261.73, while a drop below $240.52 opens the door to heavier downside risk within the expected range.
Earlier, analysts noted that Amazon’s ongoing investments in artificial intelligence and cloud infrastructure were expected to support long-term growth across its business lines. Currently, with technicals signaling a possible continuation of the recent consolidation, traders should monitor the $240.52 support and $249.28 resistance for cues on a decisive move in the coming week.











-
 Afghanistan
-
 Albania
-
 Algeria
-
 Angola
-
 Argentina
-
 Armenia
-
 Australia
-
 Austria
-
 Azerbaijan
-
 Bahamas
-
 Bahrain
-
 Bangladesh
-
 Belarus
-
 Belgium
-
 Bolivia
-
 Botswana
-
 Brazil
-
 Brunei
-
 Bulgaria
-
 Cambodia
-
 Cameroon
-
 Canada
-
 Chile
Chile
-
 China
China
-
 Colombia
-
 Congo
Congo
-
 Costa Rica
-
 Cote d'Ivoire
-
 Croatia
-
 Cuba
Cuba
-
 Cyprus
-
 Czechia
-
 DR Congo
-
 Denmark
-
 Dominican Republic
-
 Ecuador
-
 Egypt
Egypt
-
 El Salvador
-
 Estonia
-
 Eswatini
-
 Ethiopia
-
 Finland
-
 France
-
 Georgia
-
 Germany
-
 Ghana
Ghana
-
 Greece
-
 Haiti
Haiti
-
 Hong Kong
-
 Hungary
-
 India
India
-
 Indonesia
-
 Iran, Islamic republic
-
 Iraq
Iraq
-
 Ireland
-
 Israel
-
 Italy
Italy
-
 Jamaica
-
 Japan
Japan
-
 Jordan
-
 Kazakhstan
-
 Kenya
Kenya
-
 Korea
Korea
-
 Kuwait
-
 Kyrgyzstan
-
 Laos
Laos
-
 Latvia
-
 Lebanon
-
 Lesotho
-
 Libya
Libya
-
 Lithuania
-
 Luxembourg
-
 Madagascar
-
 Malaysia
-
 Malta
Malta
-
 Mauritius
-
 Mexico
-
 Moldova
-
 Mongolia
-
 Montenegro
-
 Morocco
-
 Mozambique
-
 Myanmar
-
 Namibia
-
 Nepal
Nepal
-
 Netherlands
-
 New Zealand
-
 Nigeria
-
 North Macedonia
-
 Norway
-
 Oman
Oman
-
 Pakistan
-
 Palestine
-
 Panama
-
 Papua New Guinea
-
 Paraguay
-
 Peru
Peru
-
 Philippines
-
 Poland
-
 Portugal
-
 Puerto Rico
-
 Qatar
Qatar
-
 Reunion
-
 Romania
-
 Rwanda
-
 Saudi Arabia
-
 Serbia
-
 Singapore
-
 Slovakia
-
 Slovenia
-
 Somalia
-
 South Africa
-
 Spain
Spain
-
 Sri Lanka
-
 Sweden
-
 Switzerland
-
 Syria
Syria
-
 Taiwan
-
 Tajikistan
-
 Tanzania
-
 Thailand
-
 Trinidad and Tobago
-
 Tunisia
-
 Turkey
-
 UAE
UAE
-
 Uganda
-
 Ukraine
-
 United Kingdom
-
United States
-
 Uruguay
-
 Uzbekistan
-
 Venezuela
-
 Vietnam
-
 Yemen
Yemen
-
 Zambia
-
 Zimbabwe
- Forex
- Crypto












