


Riot Platforms, Inc. (RIOT) fell 3.12% today following a sharp post-open slide, even as recent news highlighted the company's $9.1 billion AI computing lease and new ETF inclusions. Today’s downside is reinforced by mixed short-term momentum indicators and intraday volatility after the downside opening gap.
 12.94
14.44
Highlights
- Riot Platforms signed a $9.1 billion deal to lease 191 megawatts of AI computing capacity at its Texas campus, expanding beyond Bitcoin mining.
- Shares of Riot Platforms were recently added to a Harbor Capital ETF granting exposure to AI infrastructure linked to Anthropic through data-center partnerships.
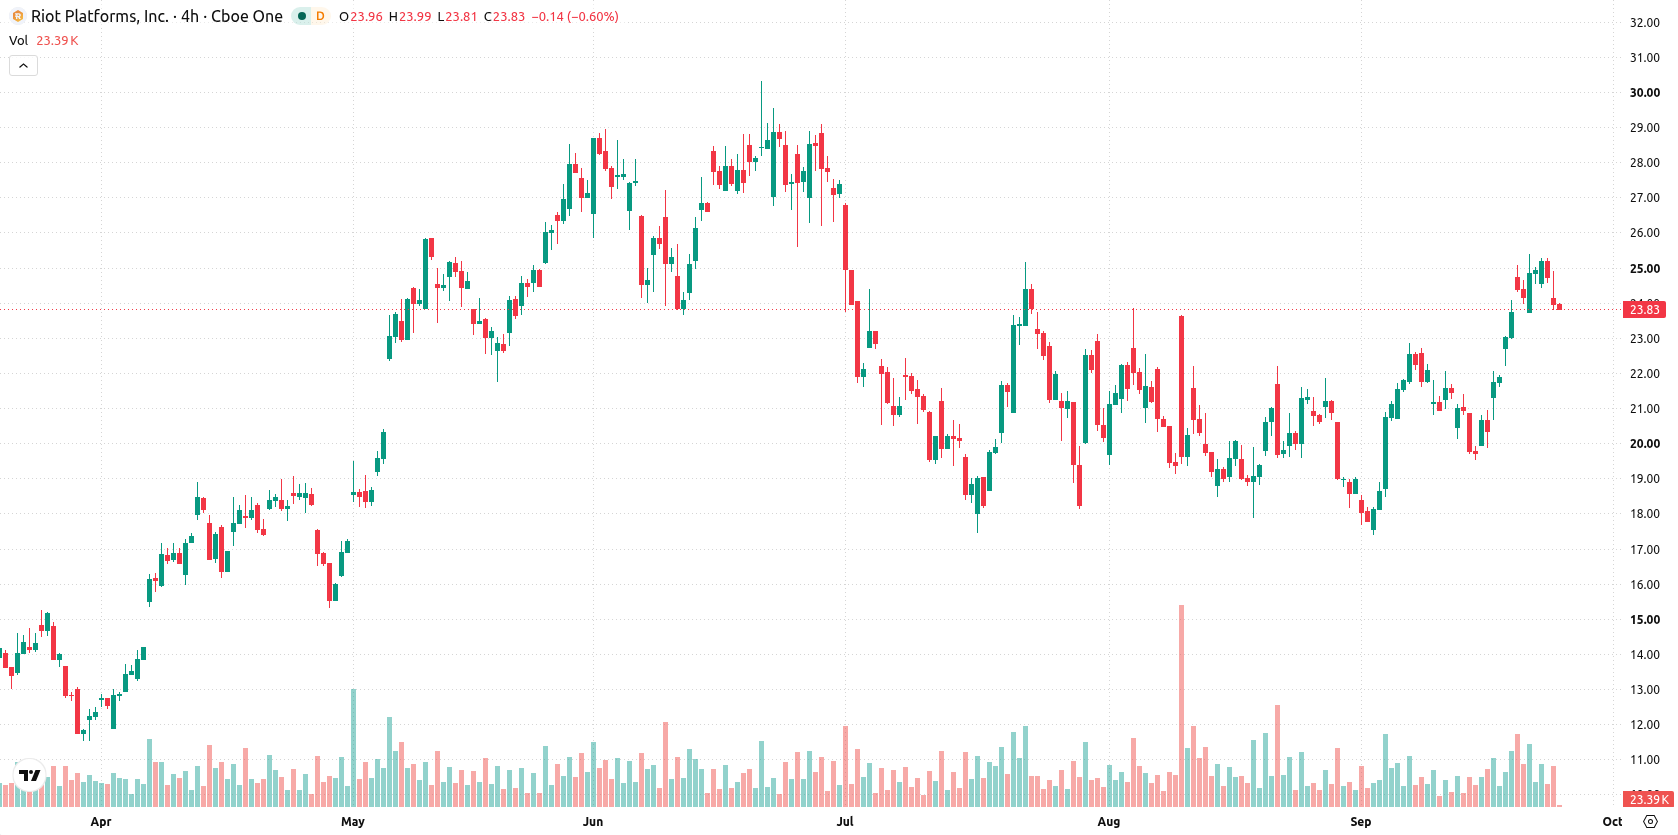
- Riot Platforms stock trades in a bullish structure above support at $23.8, with a projected five-day range of $22.35 to $25.5, although technical signals indicate overbought conditions and short-term intraday selling pressure.
ETF inflows and AI pivot counter persistent broader selling
Riot Platforms was recently included in a new Harbor Capital ETF, which offers investors exposure to infrastructure supporting Anthropic's AI ecosystem through data-center partnerships. The Defiance Daily Target 2X Long RIOT ETF (RIOX) also recorded strong recent performance, following both a surge in Bitcoin prices and Riot's shift toward AI data center operations. In a major corporate development, Riot signed a $9.1 billion agreement to lease out 191 megawatts of AI computing capacity from its Rockdale, Texas campus to a leading AI company, marking a move beyond pure Bitcoin mining, though price action has remained under broader selling pressure.
Bullish technical setup offset by overbought indicators and mixed momentum
Riot Platforms is trading above all key moving averages with the current price at $23.92, above the MA-20 ($21.28), MA-50 ($20.85), and MA-200 ($19.12). This setup confirms a prevailing bullish structure across short-, medium-, and long-term trends, strengthened further by a bullish alignment between the MA-50 and MA-200. Immediate levels to watch are the near-term ceiling at $24.92 and the near-term floor at $23.8; distant support levels further below confirm the underlying upward trend but do not limit current price action. Momentum readings are mixed. The Moving Average Convergence Divergence (MACD) at 1.33 gives a Buy forecast, indicating upward momentum. The Average Directional Index (ADX) at 13.16 signals a neutral trend and weak trend strength. Overbought signals dominate: the Relative Strength Index (RSI) is elevated at 63.15 (Buy), the Stochastic RSI at 93.32 and the Commodity Channel Index (CCI) at 159.37 both flag strong overbought conditions, and Bull/Bear Power (BBP) is strongly positive at 2.81, confirming buyers dominate intraday momentum and also signaling overbought. The Awesome Oscillator (AO) at 2.84 also supports buying momentum. After opening with a downside gap of approximately 2.39%, the stock fell $0.77, slipping 3.12% to $23.92, and is currently trading near session lows with intraday volatility at 4.71%. There is clear intraday pressure after the open, and oscillators signal a divergence as overbought conditions contrast with short-term momentum.
Earlier, analysts noted that Riot Platforms was exhibiting mixed technical signals and consolidating within a well-defined range, suggesting caution as traders awaited a clearer breakout. The current analysis reinforces this indecision, highlighting a prevailing sideways scenario where a confirmed move above $24.92 or below $23.8 could determine the stock's next directional trend.









-
 Afghanistan
-
 Albania
-
 Algeria
-
 Angola
-
 Argentina
-
 Armenia
-
 Australia
-
 Austria
-
 Azerbaijan
-
 Bahamas
-
 Bahrain
-
 Bangladesh
-
 Belarus
-
 Belgium
-
 Bolivia
-
 Botswana
-
 Brazil
-
 Brunei
-
 Bulgaria
-
 Cambodia
-
 Cameroon
-
 Canada
-
 Chile
-
 China
-
 Colombia
-
 Congo
-
 Costa Rica
-
 Cote d'Ivoire
-
 Croatia
-
 Cuba
-
 Cyprus
-
 Czechia
-
 DR Congo
-
 Denmark
-
 Dominican Republic
-
 Ecuador
-
 Egypt
-
 El Salvador
-
 Estonia
-
 Eswatini
-
 Ethiopia
-
 Finland
-
 France
-
 Georgia
-
 Germany
-
 Ghana
-
 Greece
-
 Haiti
-
 Hong Kong
-
 Hungary
-
 India
-
 Indonesia
-
 Iran, Islamic republic
-
 Iraq
-
 Ireland
-
 Israel
-
 Italy
-
 Jamaica
-
 Japan
-
 Jordan
-
 Kazakhstan
-
 Kenya
-
 Korea
-
 Kuwait
-
 Kyrgyzstan
-
 Laos
-
 Latvia
-
 Lebanon
-
 Lesotho
-
 Libya
-
 Lithuania
-
 Luxembourg
-
 Madagascar
-
 Malaysia
-
 Malta
-
 Mauritius
-
 Mexico
-
 Moldova
-
 Mongolia
-
 Montenegro
-
 Morocco
-
 Mozambique
-
 Myanmar
-
 Namibia
-
 Nepal
-
 Netherlands
-
 New Zealand
-
 Nigeria
-
 North Macedonia
-
 Norway
-
 Oman
-
 Pakistan
-
 Palestine
-
 Panama
-
 Papua New Guinea
-
 Paraguay
-
 Peru
-
 Philippines
-
 Poland
-
 Portugal
-
 Puerto Rico
-
 Qatar
-
 Reunion
-
 Romania
-
 Rwanda
-
 Saudi Arabia
-
 Serbia
-
 Singapore
-
 Slovakia
-
 Slovenia
-
 Somalia
-
 South Africa
-
 Spain
-
 Sri Lanka
-
 Sweden
-
 Switzerland
-
 Syria
-
 Taiwan
-
 Tajikistan
-
 Tanzania
-
 Thailand
-
 Trinidad and Tobago
-
 Tunisia
-
 Turkey
-
 UAE
-
 Uganda
-
 Ukraine
-
 United Kingdom
-
United States
-
 Uruguay
-
 Uzbekistan
-
 Venezuela
-
 Vietnam
-
 Yemen
-
 Zambia
-
 Zimbabwe
- Forex
- Crypto












