

TELUS shares drop around 1.5% after renewed technical momentum drives sellers

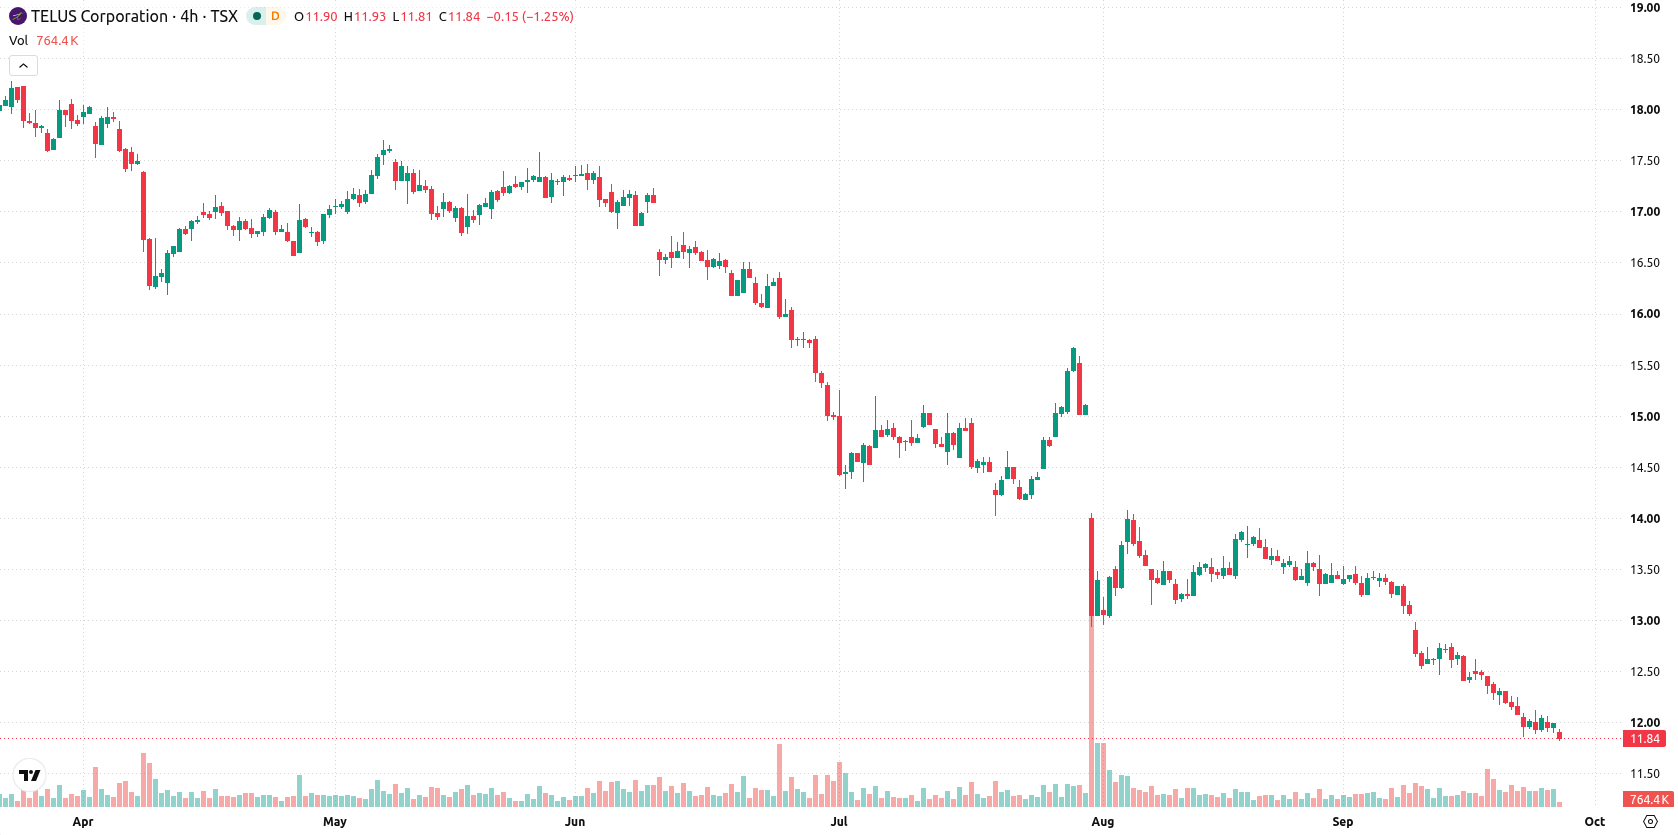
TELUS Corporation (T) extended its decline by 1.58% as renewed technical momentum and persistent bearish trends drove sellers to dominate the session. The move is supported by the stock's position below all major moving averages and mounting bearish pressure across multiple indicators.
 12.65
12.65
Highlights
- Shares of TELUS trade below all major moving averages, confirming persistent downward pressure across short, medium, and long timeframes.
- Momentum and trend-based indicators show clear weakness, with MACD, ADX, and several oscillators all in oversold territory and favoring sellers.
- The forecast range for the next five sessions is C$11.61 to C$12.03, with over 80% probability of further downside unless C$12.03 is surpassed.
Momentum oscillators and oversold readings reinforce persistent downside
TELUS is trading below its 20-day (C$12.74), 50-day (C$13.47), and 200-day (C$16.51) moving averages, indicating continued downward pressure across all observed timeframes. The Ichimoku Kijun (C$12.89) acts as immediate resistance, with technical ceilings at C$11.87 and support at C$11.61 affirming a sustained bearish setup. Momentum oscillators, including MACD and ADX, extend the case for further weakness, while the RSI, Stochastic RSI, and CCI all signal oversold conditions. Bear Power remains negative, confirming seller dominance. The Awesome Oscillator also supports the persistent downside move, with prices near session lows and volatility at 1.34%.
Earlier, analysts noted that TELUS was experiencing sustained downside momentum and a cautious technical outlook driven by persistent selling pressure. The latest data reinforce this narrative and highlight the importance of monitoring the C$11.61 support level as a potential pivot point in the current consolidation phase.










-
 Afghanistan
-
 Albania
-
 Algeria
-
 Angola
-
 Argentina
-
 Armenia
-
 Australia
-
 Austria
-
 Azerbaijan
-
 Bahamas
-
 Bahrain
-
 Bangladesh
-
 Belarus
-
 Belgium
-
 Bolivia
-
 Botswana
-
 Brazil
-
 Brunei
-
 Bulgaria
-
 Cambodia
-
 Cameroon
-
 Canada
-
 Chile
-
 China
-
 Colombia
-
 Congo
-
 Costa Rica
-
 Cote d'Ivoire
-
 Croatia
-
 Cuba
-
 Cyprus
-
 Czechia
-
 DR Congo
-
 Denmark
-
 Dominican Republic
-
 Ecuador
-
 Egypt
-
 El Salvador
-
 Estonia
-
 Eswatini
-
 Ethiopia
-
 Finland
-
 France
-
 Georgia
-
 Germany
-
 Ghana
-
 Greece
-
 Haiti
-
 Hong Kong
-
 Hungary
-
 India
-
 Indonesia
-
 Iran, Islamic republic
-
 Iraq
-
 Ireland
-
 Israel
-
 Italy
-
 Jamaica
-
 Japan
-
 Jordan
-
 Kazakhstan
-
 Kenya
-
 Korea
-
 Kuwait
-
 Kyrgyzstan
-
 Laos
-
 Latvia
-
 Lebanon
-
 Lesotho
-
 Libya
-
 Lithuania
-
 Luxembourg
-
 Madagascar
-
 Malaysia
-
 Malta
-
 Mauritius
-
 Mexico
-
 Moldova
-
 Mongolia
-
 Montenegro
-
 Morocco
-
 Mozambique
-
 Myanmar
-
 Namibia
-
 Nepal
-
 Netherlands
-
 New Zealand
-
 Nigeria
-
 North Macedonia
-
 Norway
-
 Oman
-
 Pakistan
-
 Palestine
-
 Panama
-
 Papua New Guinea
-
 Paraguay
-
 Peru
-
 Philippines
-
 Poland
-
 Portugal
-
 Puerto Rico
-
 Qatar
-
 Reunion
-
 Romania
-
 Rwanda
-
 Saudi Arabia
-
 Serbia
-
 Singapore
-
 Slovakia
-
 Slovenia
-
 Somalia
-
 South Africa
-
 Spain
-
 Sri Lanka
-
 Sweden
-
 Switzerland
-
 Syria
-
 Taiwan
-
 Tajikistan
-
 Tanzania
-
 Thailand
-
 Trinidad and Tobago
-
 Tunisia
-
 Turkey
-
 UAE
-
 Uganda
-
 Ukraine
-
 United Kingdom
-
United States
-
 Uruguay
-
 Uzbekistan
-
 Venezuela
-
 Vietnam
-
 Yemen
-
 Zambia
-
 Zimbabwe
- Forex
- Crypto












