


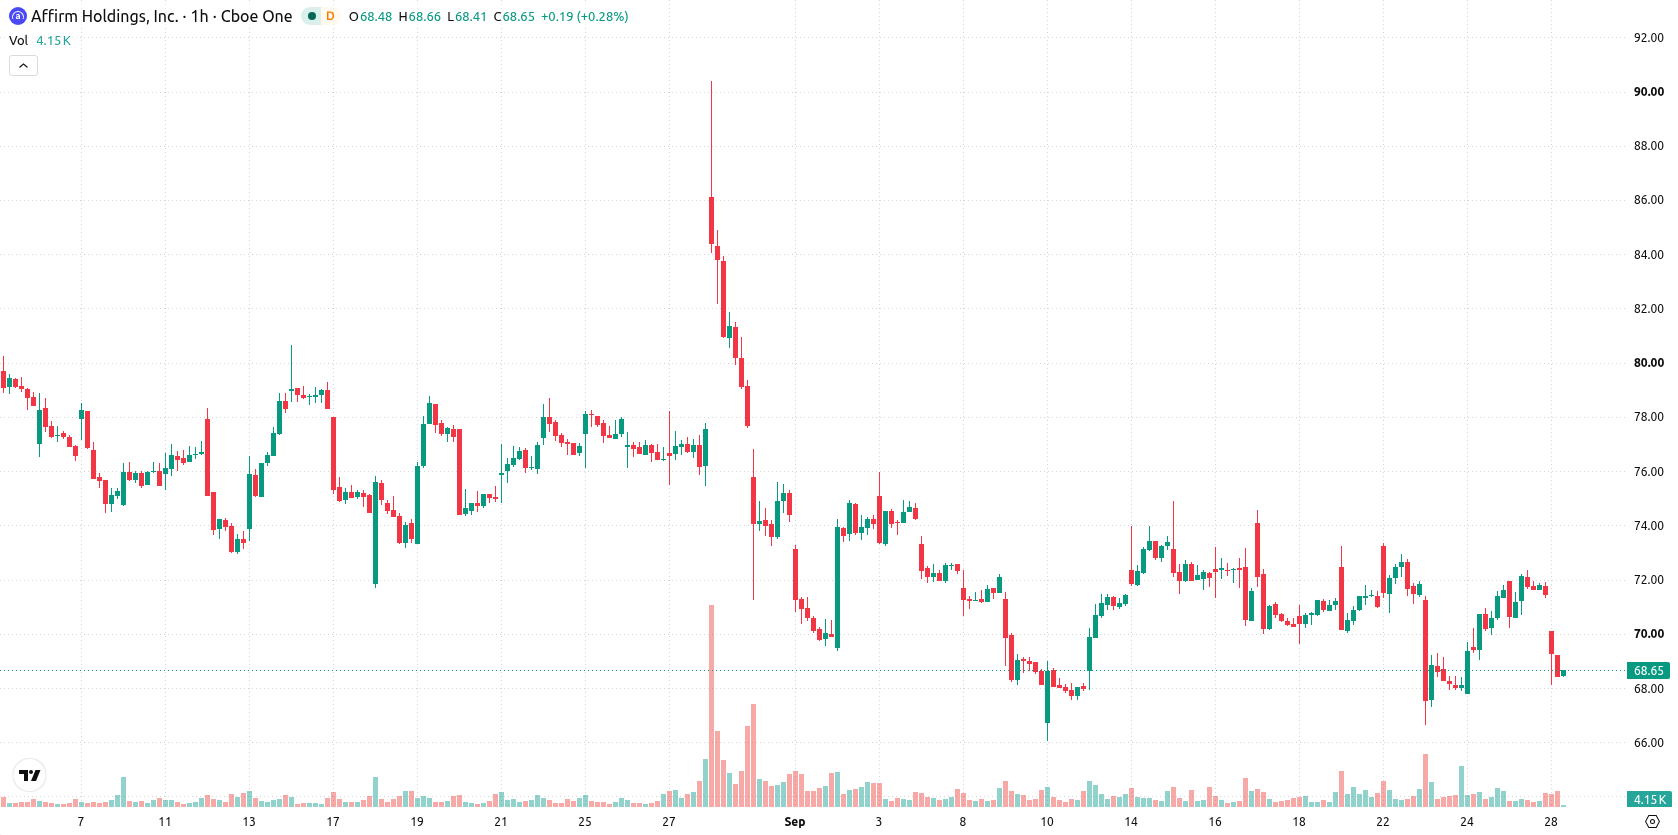
Affirm Holdings (AFRM) stock is trading at $68.67, marking a decline of 3.92% for the day. The price sits below its short- and medium-term moving averages, but remains above its long-term trend level.
 74.14
76.13
Highlights
- AFRM/USD stock trades below short- and medium-term moving averages, showing ongoing selling pressure in the near term.
- Momentum indicators are mixed with intraday signals favoring buyers, but daily price action remains weak following a 3.92% decline.
- The price is forecasted to move within a $65.86 to $72.5 range, with a 73% probability of downward movement and consolidation likely.
Mixed momentum signals as key resistance challenges upside
On the technical side, AFRM is trading below both its MA-20 and MA-50, pointing to continued short- and medium-term selling pressure, while still holding above the MA-200 which provides longer-term structural support. The Ichimoku Kijun at $69.79 is acting as immediate resistance. Momentum indicators present a mixed picture: RSI stands at 55.03 (Buy) and is corroborated by bullish signals on the MACD and CCI, alongside dominance from buyers according to Bull/Bear Power and a positive Awesome Oscillator reading. Conversely, the ADX is neutral, and the Stochastic RSI is delivering a strong sell signal, highlighting a divergence between momentum and price action.
Sideways bias expected as downside risk outweighs bullish breakout
Looking ahead, the projected range for AFRM over the next few sessions is $65.86 to $72.5, with the model assigning a 27% chance of upward movement against a 73% likelihood of further declines. The baseline scenario points to sideways consolidation within this band. For a bullish move to materialize, AFRM would need to break above immediate resistance at $69.79 and then $72.5. In contrast, a break below $65.86 would open the door to fresh downside.
Earlier, analysts noted that companies such as Meta and Lovable are seeking to diversify recurring revenue and expand platform adoption through new product and partnership strategies. For Affirm, with short- and medium-term technical signals indicating prevailing selling pressure but longer-term structural support still intact, traders should closely monitor the $65.86 downside level as a pivot for potential risk over the next several sessions.










-
 Afghanistan
-
 Albania
-
 Algeria
-
 Angola
-
 Argentina
-
 Armenia
-
 Australia
-
 Austria
-
 Azerbaijan
-
 Bahamas
-
 Bahrain
-
 Bangladesh
-
 Belarus
-
 Belgium
-
 Bolivia
-
 Botswana
-
 Brazil
-
 Brunei
-
 Bulgaria
-
 Cambodia
-
 Cameroon
-
 Canada
-
 Chile
-
 China
-
 Colombia
-
 Congo
-
 Costa Rica
-
 Cote d'Ivoire
-
 Croatia
-
 Cuba
-
 Cyprus
-
 Czechia
-
 DR Congo
-
 Denmark
-
 Dominican Republic
-
 Ecuador
-
 Egypt
-
 El Salvador
-
 Estonia
-
 Eswatini
-
 Ethiopia
-
 Finland
-
 France
-
 Georgia
-
 Germany
-
 Ghana
-
 Greece
-
 Haiti
-
 Hong Kong
-
 Hungary
-
 India
-
 Indonesia
-
 Iran, Islamic republic
-
 Iraq
-
 Ireland
-
 Israel
-
 Italy
-
 Jamaica
-
 Japan
-
 Jordan
-
 Kazakhstan
-
 Kenya
-
 Korea
-
 Kuwait
-
 Kyrgyzstan
-
 Laos
-
 Latvia
-
 Lebanon
-
 Lesotho
-
 Libya
-
 Lithuania
-
 Luxembourg
-
 Madagascar
-
 Malaysia
-
 Malta
-
 Mauritius
-
 Mexico
-
 Moldova
-
 Mongolia
-
 Montenegro
-
 Morocco
-
 Mozambique
-
 Myanmar
-
 Namibia
-
 Nepal
-
 Netherlands
-
 New Zealand
-
 Nigeria
-
 North Macedonia
-
 Norway
-
 Oman
-
 Pakistan
-
 Palestine
-
 Panama
-
 Papua New Guinea
-
 Paraguay
-
 Peru
-
 Philippines
-
 Poland
-
 Portugal
-
 Puerto Rico
-
 Qatar
-
 Reunion
-
 Romania
-
 Rwanda
-
 Saudi Arabia
-
 Serbia
-
 Singapore
-
 Slovakia
-
 Slovenia
-
 Somalia
-
 South Africa
-
 Spain
-
 Sri Lanka
-
 Sweden
-
 Switzerland
-
 Syria
-
 Taiwan
-
 Tajikistan
-
 Tanzania
-
 Thailand
-
 Trinidad and Tobago
-
 Tunisia
-
 Turkey
-
 UAE
-
 Uganda
-
 Ukraine
-
 United Kingdom
-
United States
-
 Uruguay
-
 Uzbekistan
-
 Venezuela
-
 Vietnam
-
 Yemen
-
 Zambia
-
 Zimbabwe
- Forex
- Crypto












