How To Use Standard Deviation Indicator To Spot Breakout Setups Early


Editorial Note: While we adhere to strict Editorial Integrity, this post may contain references to products from our partners. Here's an explanation for How We Make Money. None of the data and information on this webpage constitutes investment advice according to our Disclaimer.
Standard Deviation is a volatility indicator that helps traders spot when the market is quiet or heating up. It doesn’t predict direction, but it shows when price is tightening, often right before a breakout. When Standard Deviation rises sharply after a long flat period, it signals that energy is returning to the market. Smart traders use it to watch for pressure building beneath the surface and prepare for moves before they explode.
Standard Deviation is often seen as just a way to measure how much price is bouncing around but it is actually a tool most people overlook. A lot of traders just throw it on with Bollinger Bands or use it to adjust position size without thinking about what it is really showing. What makes it useful is when you start to watch how things build up before they snap. The biggest moves in the market usually come after everything goes quiet. In this article, we will take a detailed look into this indicator, discussing its origin, use, strategies, an a lot more.
Understanding standard deviation indicator
The Standard Deviation indicator helps you understand how much price is moving around, whether the market is calm or getting wild. It doesn’t tell you where price is going, but it does show whether things are heating up or slowing down.
What it shows
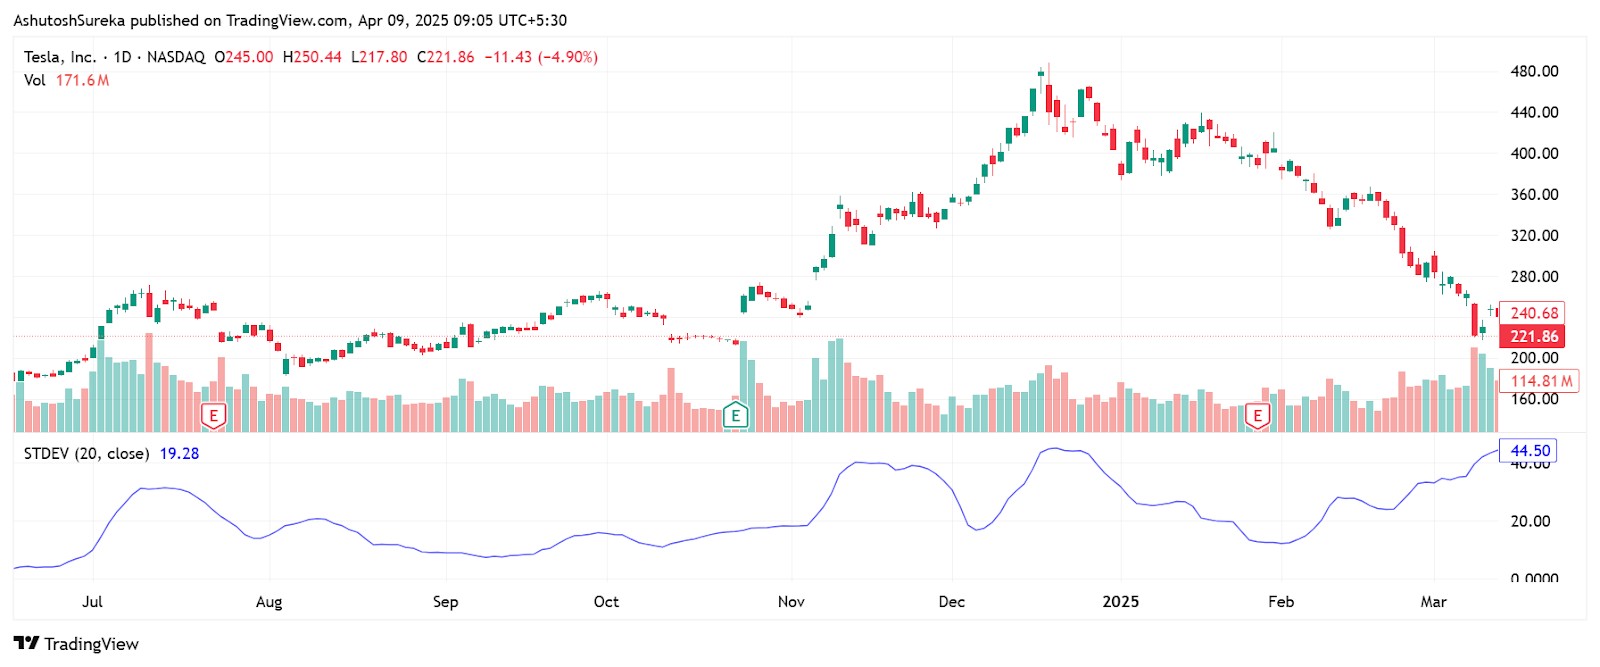
If the line is rising, price is moving more and volatility is increasing.
If it’s flat, the market is quiet and moving sideways.
It helps you decide when it’s worth trading or when to hold back.
Traders often use it with trend indicators or in breakout setups to spot when something big might be coming.
Origin and development of standard deviation indicator
This tool comes from classic statistics. Standard deviation has been used in math and finance for decades to measure how spread out numbers are. In trading, it tells us how far price is wandering from its average.
How it got here
The math behind it has been around for over 100 years.
In charts, it became popular when John Bollinger built his Bollinger Bands using it.
Since then, traders started using the standard deviation line on its own to watch volatility.
Why it’s still used
It gives a quick read on how active the market is.
If volatility is rising, it can hint that a breakout or reversal might be near.
If it’s dropping, the market might be in a pause, and that’s useful to know too.
Understanding the standard deviation indicator formula
This formula shows how much price bounces around from its average. If price is sticking close to the mean, standard deviation is low. If it’s flying all over the place, the number goes up, and so does the market’s energy.
Here’s how it works
Standard Deviation = {∑ (P − Average) ^ 2 / n} ^ 1/2
You take each price, subtract the average, square the result, average those squared values, and then take the square root.
Why it matters
Squaring the differences helps highlight big moves.
Taking the average keeps everything balanced.
The square root turns it into something that matches the price scale.
What it tells you
If the number is high, the market is moving a lot.
If it’s low, things are quiet and steady.
It doesn’t say which direction, just how wild or calm price is.
What is deviation in Forex
In Forex trading, deviation refers to how much the price of a currency pair moves away from a reference point, usually its average, expected value, or your desired entry/exit price. It’s a term that shows up in two common ways: as a statistical measure (like in volatility indicators) and as a setting on trading platforms that affects how orders are filled.
Deviation as a measure of price volatility
In indicators like Standard Deviation, deviation tells you how much price is fluctuating compared to its average.
A high deviation means price is moving sharply and the market is volatile.
A low deviation means price is staying near its average and the market is calm.
This type of deviation helps traders decide whether to tighten stops, wait for a breakout, or avoid trading altogether.
Deviation as a trading platform setting
On platforms like MetaTrader, deviation is a setting that controls how much slippage you’re willing to accept.
If price changes slightly by the time your order is processed, deviation tells the platform whether to still execute the trade or not.
Example:
If your set deviation is 3 pips, and the price moves 2 pips while your order is executing, the trade goes through.
If the price moves more than 3 pips, the order is rejected unless you adjust your settings.
How to set up standard deviation indicator
The Standard Deviation indicator is built into most trading platforms and can be added to a chart in just a few clicks. Once it’s active, it plots a line that moves up and down depending on market volatility. A rising line signals increased price movement, while a flat line shows a calmer market. You can use it on its own or alongside trend tools to gauge when volatility is expanding or contracting.
Access the indicator

Adding the Standard Deviation indicator to your chart is fast and straightforward.
How to do it
Open the indicators menu in your charting platform.
Type Standard Deviation in the search bar.
Click to apply it, the line will appear below your main chart in a separate pane.
Where it’s available
Pre-installed on TradingView, MetaTrader 4 and 5, ThinkorSwim, and most other charting tools.
No external downloads or plug-ins are required.
Configure the parameters

Once added, you can adjust the indicator’s settings to match your trading style and timeframe.
Default settings
The standard input is a 20-period.
This calculates the standard deviation of closing prices over the last 20 candles.
It offers a balanced view of short- to mid-term volatility.
How to adjust it
Shorter periods (e.g. 10 or 14)
- Respond more quickly to price changes;
- Ideal for intraday or short-term traders;
- May produce more noise;
Longer periods (e.g. 30 or 50)
- Smooth out the curve for bigger-picture moves;
- Better for swing or position traders looking at higher timeframes;
Visual tweaks
Change the color and thickness of the line for better visibility.
Pair it with a moving average or price channel for context.
Add it inside Bollinger Bands if you prefer it as part of a volatility envelope.
Trading strategies using standard deviation indicator
The Standard Deviation indicator doesn’t show direction, it shows how much the market is moving. This makes it a great tool for spotting breakout potential, identifying quiet zones, or confirming volatility behind price moves. It works well as a filter or timing tool when used with trendlines, moving averages, or price patterns.
Breakout anticipation strategy

Before big moves, markets often go quiet. A low standard deviation reading can signal that a breakout may be coming soon.
How to trade it
Look for periods when the line is flat or falling.
Watch for price consolidating in a tight range (like a triangle or sideways box).
When price breaks the range and standard deviation starts rising, it confirms the breakout is real.
Tips
Combine this with support-resistance zones for better entries.
You can also set alerts when standard deviation rises from a low base.
Volatility filter for trend setups

Not all trends are worth trading, some are slow and choppy. Standard Deviation helps confirm when a trend has enough momentum to follow through.
How to trade it
Use a moving average (like the 50 EMA) to find the trend direction.
Enter only when the trend is strong and standard deviation is rising.
Avoid entering when the market is moving in one direction but volatility is falling.
Why it works
A strong trend with rising volatility shows follow-through.
It helps avoid false breakouts or slow, indecisive moves.
High volatility reversal strategy

Sometimes, a spike in volatility happens at the end of a trend, not the start. Standard Deviation can help you spot this when price moves sharply and then suddenly stalls.
How to use it
Watch for a surge in standard deviation during a big price move.
If the price reaches a major support or resistance level at the same time, this could signal exhaustion.
Wait for price to pause or reverse, then trade the other way with tight risk control.
Range trading during low volatility

Low standard deviation can also be a signal to stay out, or to trade inside a defined range instead of expecting breakouts.
How to approach it
When the line is flat for a while, expect sideways movement.
Look for clear horizontal support and resistance.
Use oscillators (like RSI) to fade the extremes while standard deviation stays low.
If your trading strategy requires the use of many technical indicators, using a broker that supports TradingView, MT5, or cTrader can make your life easier. These tools provide access to a wide range of technical tools, covering almost all the strategies you can think of. In the table below, we have presented the top brokers with access to the abovementioned platforms. You can compare them and choose the best one for yourself:
| Currency pairs | Crypto | Stocks | Min. deposit, $ | Max. leverage | TradingView | MT5 | cTrader | Regulation | TU overall score | Open an account | |
|---|---|---|---|---|---|---|---|---|---|---|---|
| 120 | Yes | Yes | 1 | 1:30 | Yes | Yes | Yes | CNMV | 5.47 | Study review | |
| 90 | Yes | Yes | No | 1:500 | Yes | Yes | Yes | ASIC, FCA, DFSA, BaFin, CMA, SCB, CySec | 9.25 | Go to broker Your capital is at risk.
|
|
| 90 | Yes | Yes | 1 | 1:500 | Yes | Yes | Yes | ASIC, VFSC, FSA | 9.2 | Go to broker Your capital is at risk. |
|
| 70 | Yes | Yes | 100 | 1:500 | No | Yes | Yes | FCA, CYSEC, FSCA, SCB, FSA (Seychelles) | 8.6 | Go to broker Your capital is at risk. |
|
| 100 | Yes | Yes | No | 1:500 | Yes | Yes | Yes | FSA, FMA | 8.13 | Go to broker Your capital is at risk. |
Why trust us
15+ years of independent market analysis
140+ evaluation criteria, reviewed by 50+ experts
Data-driven reviews of 200+ platforms, updated regularly
20+ industry awards & a wide network of global media partners
Learn more about our methodology and editorial policies.


Pros and cons of standard deviation indicator
The Standard Deviation indicator is a go-to tool for measuring market volatility. It doesn’t predict direction, instead, it shows how active or quiet the market is. This makes it a valuable filter for breakouts, reversals, and trend confirmations. Still, like any tool, it has blind spots, especially when used without context.
- Pros
- Cons
It gives you a clear read on volatility. When the standard deviation line rises, it means the market is getting active; when it flattens out, things are cooling off. That makes it easier to avoid dead zones and catch moves when they’re just starting to build momentum.
It works best as a supporting tool. Standard deviation isn’t a standalone signal, but it shines when paired with moving averages, RSI, or price setups. It helps confirm whether a breakout or trend has real strength behind it.
It’s simple and visual, even for beginners. The line just expands and contracts based on how much price is moving, no confusing levels or interpretation needed. You can tweak it for any timeframe, so it fits right into your style.
It helps shape your risk game. When volatility spikes, it signals that you may need wider stops or smaller positions. During quiet periods, it’s a cue to tighten things up and stay selective.
It doesn’t show you where the price is headed. Standard deviation tells you how much price is moving, not whether it’s going up or down. You’ll need another tool to help confirm trend direction before acting on it.
It can react too slowly in fast markets. Since it’s based on past data, it may miss the early part of a breakout. Price can start moving before the indicator catches up, which means you might be late if you rely on it alone.
It’s not a trade signal by itself. The line shows volatility, not entries or exits. To make it useful, you’ll need to combine it with price action, trendlines, or support and resistance levels.
Settings need to match your strategy. A default setting might be perfect on one chart and completely off on another. You'll want to experiment with different periods depending on your asset, timeframe, and trading style.
Watch the quiet buildup, not the spike

Most beginners get caught waiting for a big move and think the spike in Standard Deviation is the sign to jump in. But what really matters is the quiet before it. When the line stays low and flat for too long it shows you something is about to shift. It is like a room getting too quiet before someone slams a door. That tension builds when price stalls and traders stop disagreeing. When that calm starts to crack and you see price press against a key level that is when you pay attention. It is not the indicator alone. It is what price does while that tension builds.
Here is something most people never mention. Pay attention to how fast Standard Deviation picks up, not just how high it goes. When it turns upward sharply after being quiet that is your cue that the market is waking up. That shift tells you to get in before the crowd catches it. If you add that to signs like low-volume candles or failed breakouts you are spotting the kind of move that happens when nobody is ready. You are not reacting to the price you are picking up on tension and catching the moment before it breaks.
Conclusion
Standard Deviation will not tell you which side to pick but it will show you when the market is getting ready to move. If you stop treating it like just a number on the screen and start watching when it shifts and how fast it builds you will start spotting things others are not looking at. It is not about grabbing perfect entries. It is about catching the moment before the move happens. When you let Standard Deviation help you find where the pressure is building you stop reacting and start reading the mood. That is what helps you stay ready before the rest of the market catches on.
FAQs
How is standard deviation different from ATR?
Standard deviation measures the dispersion of price from its average, reflecting overall market volatility. ATR (Average True Range) focuses on the range between highs and lows, measuring short-term price movement intensity.
Can standard deviation be used for Forex trading?
Yes, standard deviation is used in Forex trading to assess volatility and set risk levels. It helps traders identify breakout points or determine when markets are too quiet or too active.
What is the meaning of 2 standard deviations?
Two standard deviations represent a range where approximately 95% of price data is expected to fall in a normal distribution. It’s commonly used in Bollinger Bands to indicate potential overbought or oversold levels.
What is a good standard deviation for a trading portfolio?
A lower standard deviation indicates more stable returns, which is preferred for conservative portfolios. A good range typically falls between 10% to 20%, depending on risk tolerance and investment strategy.
Editors' Top Picks and Insights

Toncoin becomes Gram: Why Durov restored token's original name

Why Tether flipping Ethereum is a pivotal moment for crypto

MiCA deadline: Why crypto companies are leaving Europe

From “Holy Trinity” to WLD crash: How Arthur Hayes became a market-moving seller

The world's first trillionaire: How Musk built his fortune on electric cars, space and AI

How precious-metals mining revival is reshaping portfolios in 2026
Related Articles
Team that worked on the article
Parshwa is a content expert and finance professional possessing deep knowledge of stock and options trading, technical and fundamental analysis, and equity research. As a Chartered Accountant Finalist, Parshwa also has expertise in Forex, crypto trading, and personal taxation.
Chinmay Soni is a financial analyst with more than 5 years of experience in working with stocks, Forex, derivatives, and other assets. As a founder of a boutique research firm and an active researcher, he covers various industries and fields, providing insights backed by statistical data.
Mirjan Hipolito is a journalist and news editor at Traders Union. She is an expert crypto writer with five years of experience in the financial markets.
Bollinger Bands (BBands) are a technical analysis tool that consists of three lines: a middle moving average and two outer bands that are typically set at a standard deviation away from the moving average. These bands help traders visualize potential price volatility and identify overbought or oversold conditions in the market.
An investor is an individual, who invests money in an asset with the expectation that its value would appreciate in the future. The asset can be anything, including a bond, debenture, mutual fund, equity, gold, silver, exchange-traded funds (ETFs), and real-estate property.
Breakout trading is a trading strategy that focuses on identifying and profiting from significant price movements that occur when an asset's price breaches a well-defined level of support or resistance.
The deviation is a statistical measure of how much a set of data varies from the mean or average value. In forex trading, this measure is often calculated using standard deviation that helps traders in assessing the degree of variability or volatility in currency price movements.
Index in trading is the measure of the performance of a group of stocks, which can include the assets and securities in it.

-
 Afghanistan
-
 Albania
-
 Algeria
-
 Angola
-
 Argentina
-
 Armenia
-
 Australia
-
 Austria
-
 Azerbaijan
-
 Bahamas
-
 Bahrain
-
 Bangladesh
-
 Belarus
-
 Belgium
-
 Bolivia
-
 Botswana
-
 Brazil
-
 Brunei
-
 Bulgaria
-
 Cambodia
-
 Cameroon
-
 Canada
-
 Chile
Chile
-
 China
China
-
 Colombia
-
 Congo
Congo
-
 Costa Rica
-
 Cote d'Ivoire
-
 Croatia
-
 Cuba
Cuba
-
 Cyprus
-
 Czechia
-
 DR Congo
-
 Denmark
-
 Dominican Republic
-
 Ecuador
-
 Egypt
Egypt
-
 El Salvador
-
 Estonia
-
 Eswatini
-
 Ethiopia
-
 Finland
-
 France
-
 Georgia
-
 Germany
-
 Ghana
Ghana
-
 Greece
-
 Haiti
Haiti
-
 Hong Kong
-
 Hungary
-
 India
India
-
 Indonesia
-
 Iran, Islamic republic
-
 Iraq
Iraq
-
 Ireland
-
 Israel
-
 Italy
Italy
-
 Jamaica
-
 Japan
Japan
-
 Jordan
-
 Kazakhstan
-
 Kenya
Kenya
-
 Korea
Korea
-
 Kuwait
-
 Kyrgyzstan
-
 Laos
Laos
-
 Latvia
-
 Lebanon
-
 Lesotho
-
 Libya
Libya
-
 Lithuania
-
 Luxembourg
-
 Madagascar
-
 Malaysia
-
 Malta
Malta
-
 Mauritius
-
 Mexico
-
 Moldova
-
 Mongolia
-
 Montenegro
-
 Morocco
-
 Mozambique
-
 Myanmar
-
 Namibia
-
 Nepal
Nepal
-
 Netherlands
-
 New Zealand
-
 Nigeria
-
 North Macedonia
-
 Norway
-
 Oman
Oman
-
 Pakistan
-
 Palestine
-
 Panama
-
 Papua New Guinea
-
 Paraguay
-
 Peru
Peru
-
 Philippines
-
 Poland
-
 Portugal
-
 Puerto Rico
-
 Qatar
Qatar
-
 Reunion
-
 Romania
-
 Rwanda
-
 Saudi Arabia
-
 Serbia
-
 Singapore
-
 Slovakia
-
 Slovenia
-
 Somalia
-
 South Africa
-
 Spain
Spain
-
 Sri Lanka
-
 Sweden
-
 Switzerland
-
 Syria
Syria
-
 Taiwan
-
 Tajikistan
-
 Tanzania
-
 Thailand
-
 Trinidad and Tobago
-
 Tunisia
-
 Turkey
-
 UAE
UAE
-
 Uganda
-
 Ukraine
-
 United Kingdom
-
United States
-
 Uruguay
-
 Uzbekistan
-
 Venezuela
-
 Vietnam
-
 Yemen
Yemen
-
 Zambia
-
 Zimbabwe
- Forex
- Crypto
