Essential Forex Chart Patterns For Successful Trading


Editorial Note: While we adhere to strict Editorial Integrity, this post may contain references to products from our partners. Here's an explanation for How We Make Money. None of the data and information on this webpage constitutes investment advice according to our Disclaimer.
Best Forex chart patterns are:
Head and Shoulders - Signals potential market reversal.
Flag Pattern Strategy - Continuation pattern in strong trends.
Double Top - Reversal pattern indicating trend change.
Engulfing Patterns (Bullish and Bearish) - Shows strong price reversal signals.
Morning Star - Bullish reversal after a downtrend.
Piercing Line - Bullish signal after a price dip.
Hammer - Indicates potential bullish reversal.
Doji - Market indecision or trend reversal signal.
Shooting Star - Bearish reversal at market peak.
Harami - Signals trend reversal or market pause.
Chart patterns play a crucial role in the realm of Forex trading, as they provide valuable insights into the market's underlying psychology and potential future price movements. Understanding and identifying these patterns can significantly enhance a trader's decision-making process, ultimately leading to more informed and profitable trades.
In this article, we will explore the top 10 most effective Forex chart patterns that experienced traders use to boost their trading performance. By understanding these patterns and their principles, you will be better prepared to navigate the complexities of the Forex market and make informed trading decisions.
Top 10 Forex chart patterns
The following are the top 10 Forex chart patterns that every trader should know, as suggested by our experts:
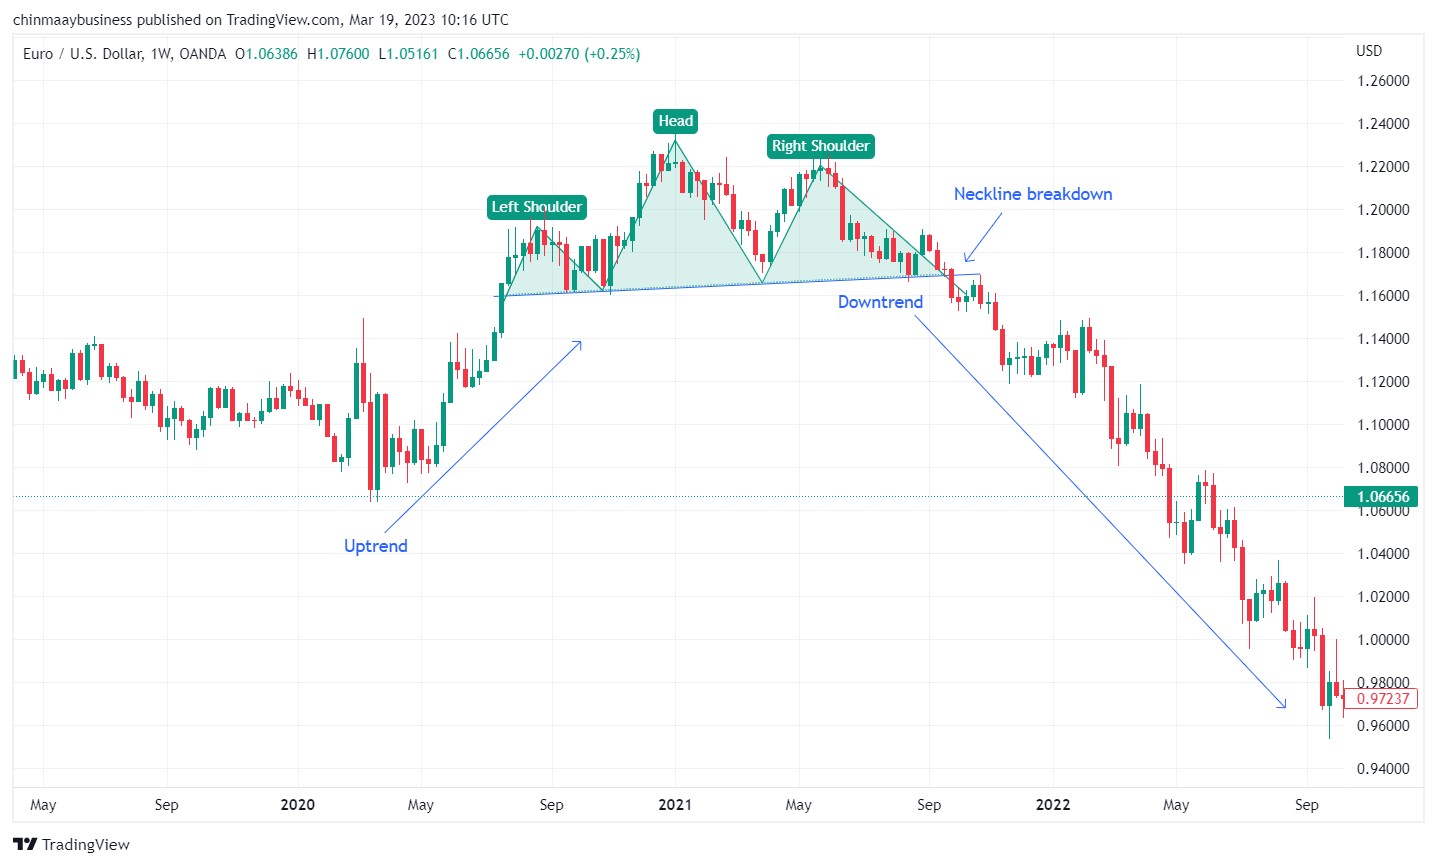
1. Head and shoulders pattern
The Head and Shoulders pattern is a popular trading strategy used to identify trend reversals. It forms when a central peak (the head) is flanked by two lower peaks (the shoulders), creating a distinct price formation on the chart. Traders use this pattern to determine entry and exit points.
Entry point. Enter the trade when the price breaks below the neckline, drawn by connecting the lows between the head and shoulders.
Exit point. Measure the height from the head’s peak to the neckline, then project this distance downward to set a target price for exiting.
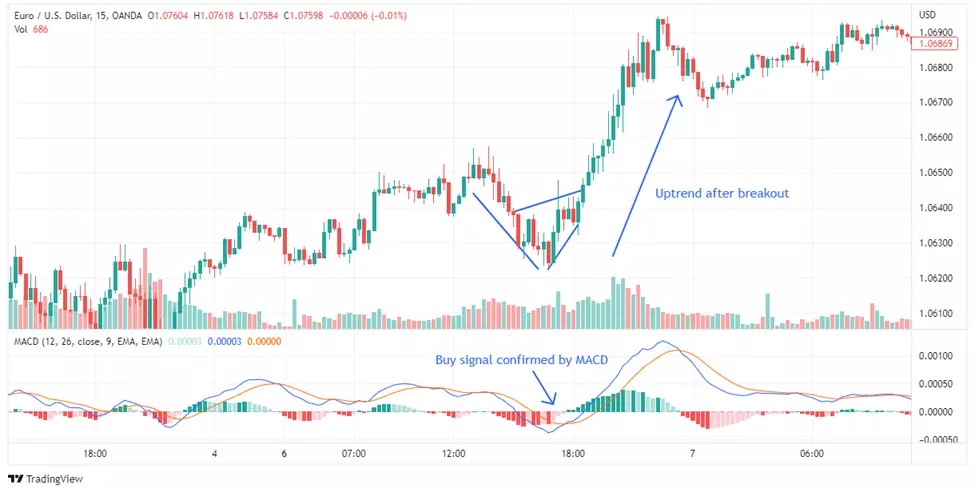
2. Flag pattern strategy
The Flag Pattern strategy helps traders spot potential trend continuations after a brief consolidation in price. This pattern signals that the current uptrend or downtrend is likely to resume, offering clear trading opportunities.
Entry point. For a bullish flag, enter a long trade when the price breaks above the flag’s upper boundary, indicating a trend continuation.
Exit point. Measure the flagpole's length (the initial price move) and project it from the breakout point. This target guides when to exit the trade for maximum profit. This method balances precision and profitability.
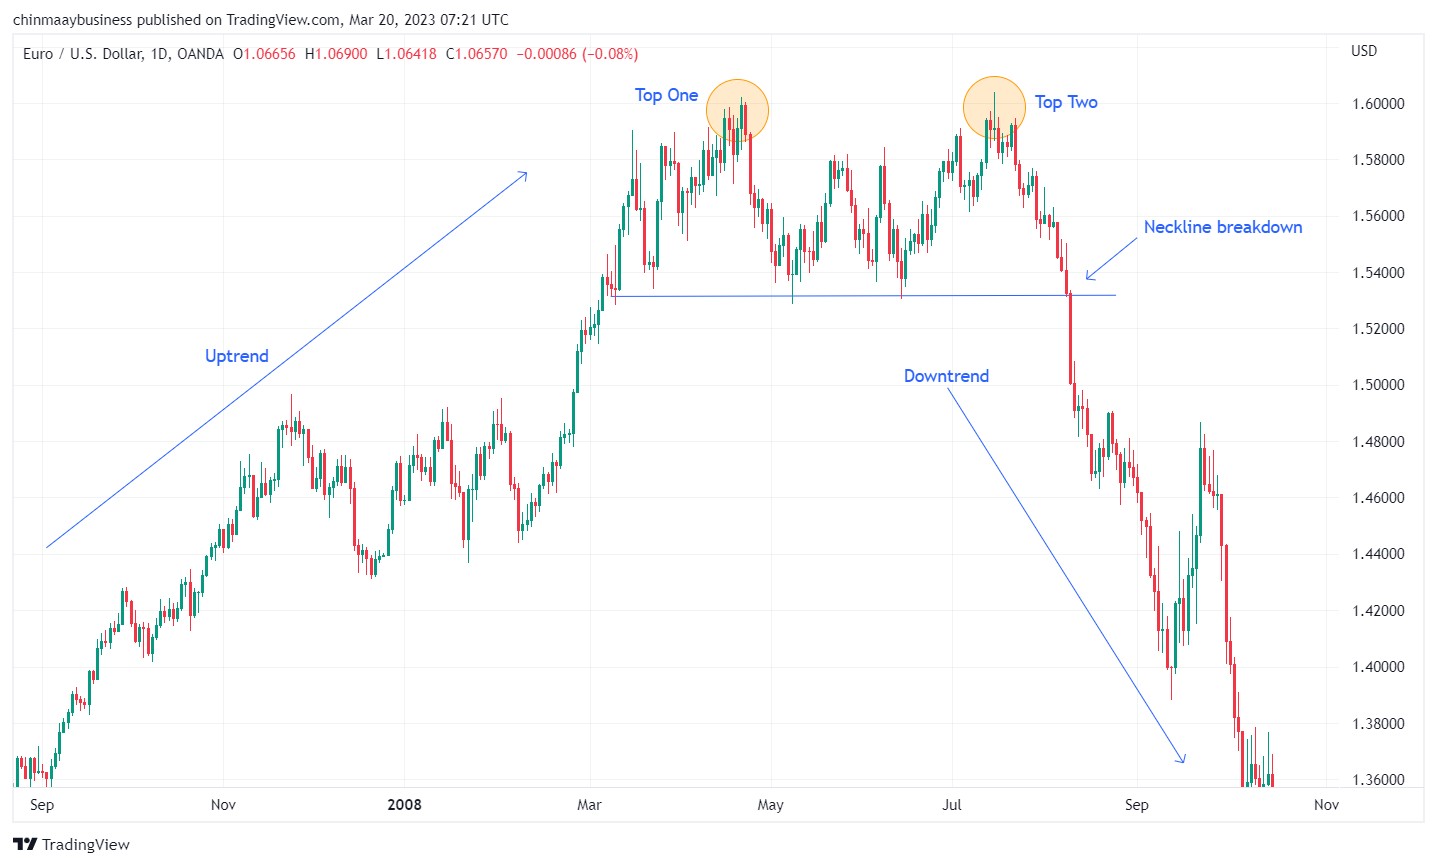
3. Double Top pattern
The double-top pattern is a reliable reversal signal, indicating a potential trend change from bullish to bearish. It forms when an asset’s price creates two similar peaks with a trough (neckline) between them, signaling weakening upward momentum.
Entry point. Enter a short position when the price breaks below the neckline after forming the second peak. This breakdown suggests a likely downward trend.
Exit point. Measure the vertical distance from the peaks to the neckline and project it downward from the neckline. This target helps determine a profitable exit point.
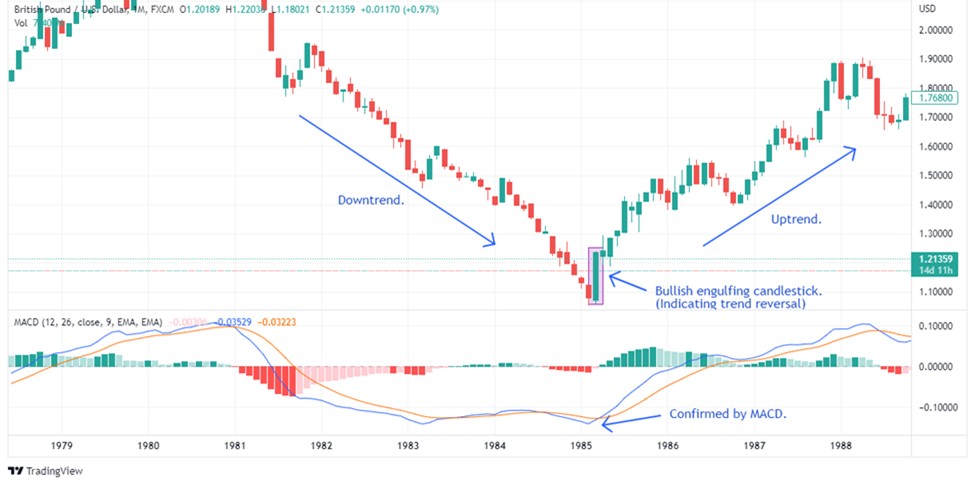
4. Engulfing pattern
The engulfing pattern is a two-candle reversal pattern signaling a potential trend change. It appears when a smaller candlestick is fully covered by a larger one, indicating a shift in market sentiment. In a bullish engulfing pattern, a bearish candle is followed by a larger bullish candle, suggesting a possible upward reversal.
Entry point. Enter a long trade after the second bullish candle closes.
Exit point. Close the trade at a key resistance level or if the price shows signs of reversal.
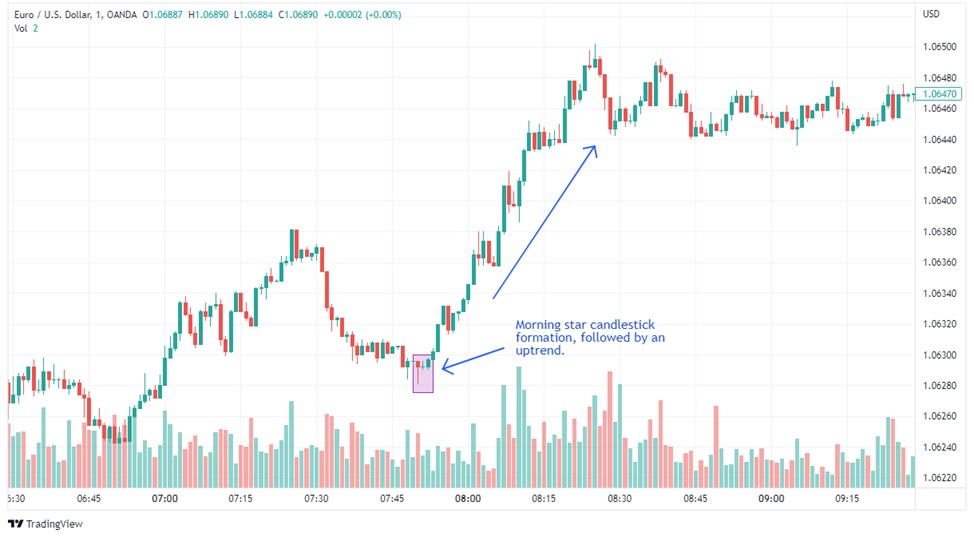
5. Morning Star pattern
The Morning Star is a three-candlestick pattern signaling a potential bullish reversal. It starts with a long red candle, followed by a small-bodied candle (red or green) that gaps lower, reflecting market indecision. A strong green candle closing within the first candle's range confirms the reversal.
Entry point. Enter a long trade after the green candle closes within the first red candle’s range, indicating upward momentum.
Exit point. Use Fibonacci retracement or key resistance levels to determine an appropriate exit, ensuring profit-taking before possible trend reversals.
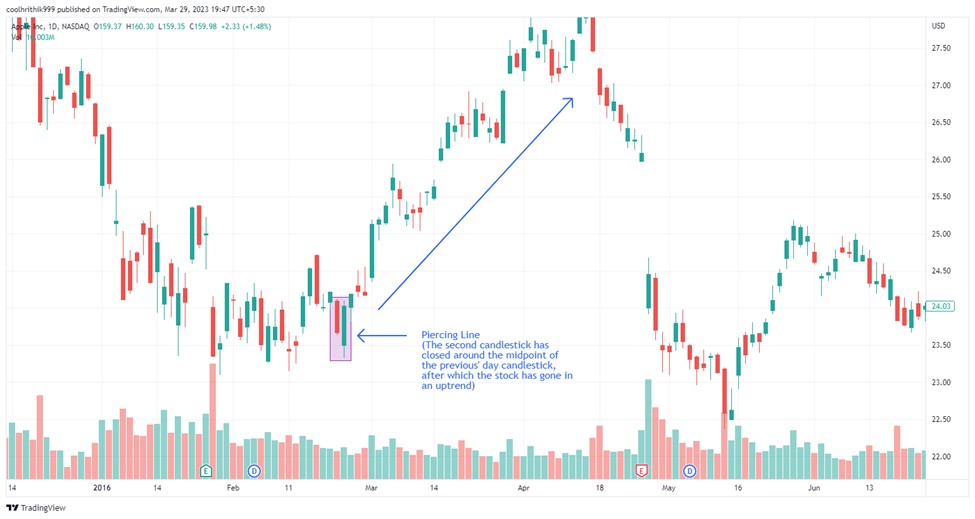
6. Piercing line pattern
The Piercing Line pattern is a two-candle formation signaling a potential bullish reversal. It features a long red candle followed by a long green candle that opens below the red candle’s low and closes above its midpoint. This close indicates growing buyer strength, hinting at a possible trend reversal.
Entry point: Enter a long trade when the green candle closes above the red candle's midpoint, confirming bullish momentum.
Exit point: Identify key resistance levels or past reversal points. Calculate a target price by measuring the distance between the green candle’s low and the red candle’s high and adding it to the green candle’s high.
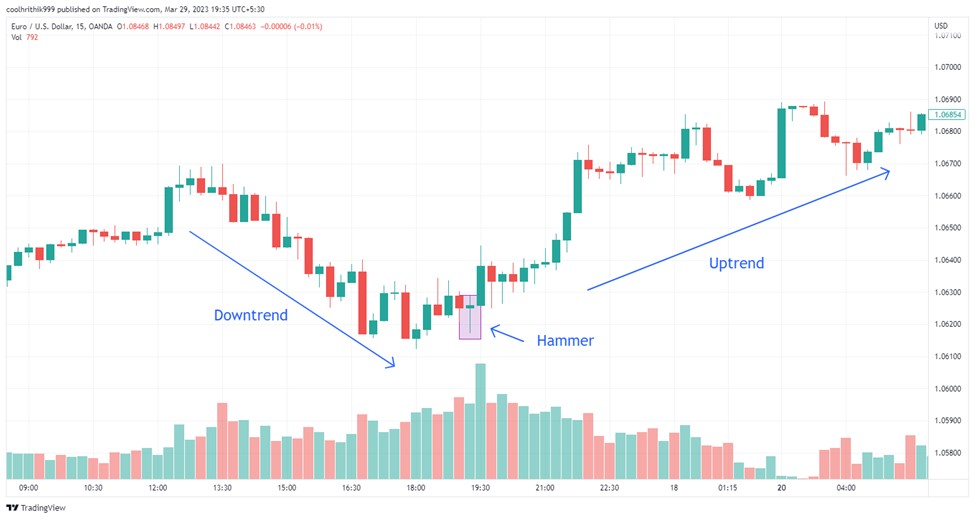
7. Hammer pattern
The Hammer pattern signals a potential bullish reversal after a downtrend. It forms when a price drops significantly but recovers, closing near its opening level. The long lower shadow indicates strong buying pressure despite early selling, hinting at a market turnaround.
Entry point. Look for a small-bodied candle with a long lower shadow at the end of a downtrend. Enter a long trade once the pattern is confirmed by a bullish close.
Exit point. Use key resistance levels, previous reversal points, or technical indicators like moving averages and trendlines to set a realistic target price and secure profits.
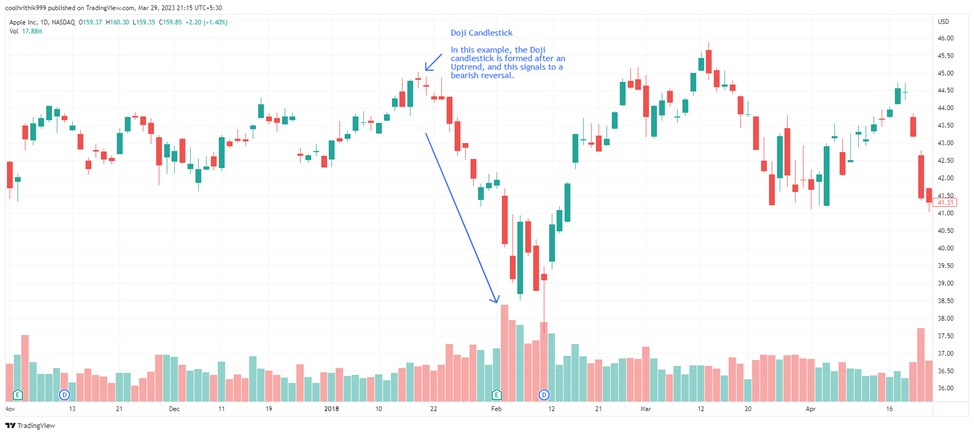
8. Doji pattern
The Doji candlestick pattern signals market indecision, forming when a security’s opening and closing prices are nearly identical. Its minimal body and possible long shadows reflect a balance between buyers and sellers. Depending on prior candles and the market trend, it can suggest either a trend reversal or continuation.
Entry point. If a Doji appears after a strong trend, it may signal a reversal. Enter a trade in the opposite direction once the next candle confirms the reversal.
Exit point. Use Fibonacci retracements, support, resistance levels, or other technical indicators to set target prices and manage trades effectively.
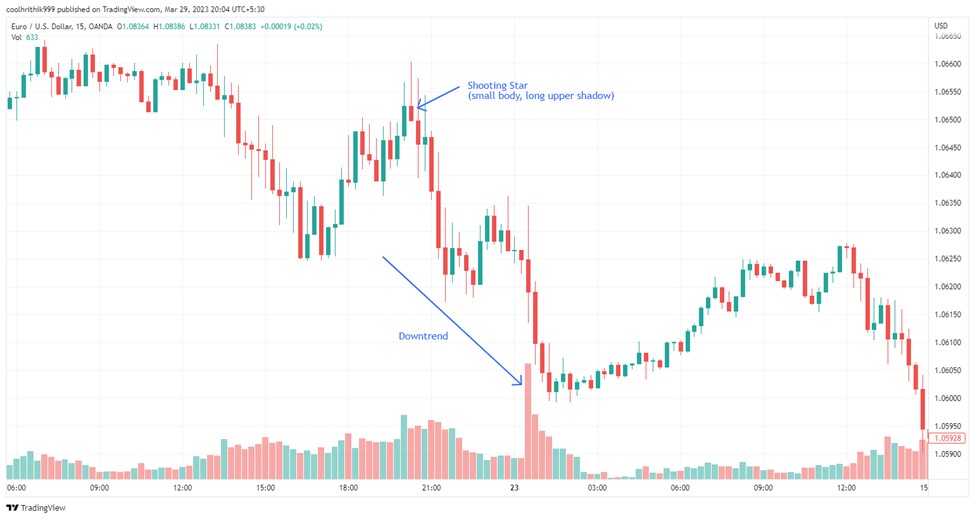
9. Shooting Star pattern
The Shooting Star is a bearish reversal candlestick that forms after an uptrend. It has a small body, long upper shadow, and little to no lower shadow, indicating strong selling pressure after buyers initially pushed prices higher. This suggests a potential trend reversal to the downside.
Entry point. Confirm the shooting star after a significant uptrend. Its long upper shadow signals weakening bullish momentum. Enter a short trade after the next bearish candle confirms the reversal.
Exit point. Use nearby support levels where the price previously rebounded. Consider additional technical indicators like trendlines or moving averages to refine your target price and maximize profits.
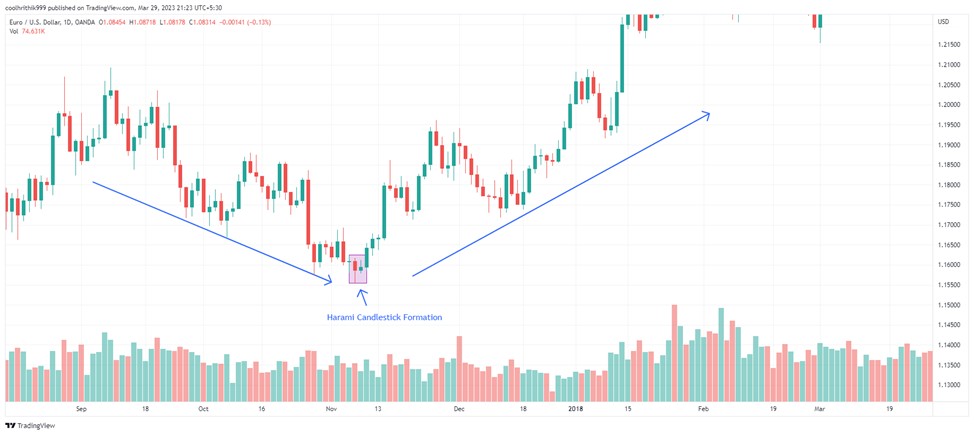
10. Harami pattern
The Harami pattern signals potential trend reversals or market consolidation. It consists of two candles: a large-bodied first candle followed by a smaller-bodied candle entirely within the first candle's range. This smaller candle indicates weakening market momentum, suggesting a potential trend change or consolidation phase.
Entry point. Look for the Harami pattern after a strong uptrend or downtrend. The smaller candle signals a possible reversal. Enter a trade in the opposite direction once the next candle confirms the trend change.
Exit point. Use key technical indicators like moving averages or support and resistance levels. If the price nears a critical moving average (e.g., 50 days or 200 days), consider setting your target price there. Alternatively, use the Average True Range (ATR) to gauge market volatility. Multiply the ATR value by a factor to estimate a realistic target price based on recent price fluctuations, improving your trade management strategy.
To trade Forex using chart patterns effectively, choosing the right broker is essential. A reliable broker provides access to advanced trading platforms, competitive spreads, and efficient trade execution, ensuring your trading strategy performs at its best. We have selected a list of top brokers for 2025 known for their exceptional services, trading tools, and user-friendly platforms. Explore these trusted brokers to elevate your trading experience and maximize the potential of Forex chart pattern strategies.
| Tradable assets | Min. deposit, $ | Demo | ECN Spread EUR/USD | Standard EUR/USD spread | Deposit fee, % | Withdrawal fee, % | Max. Regulation Level | TU overall score | Open an account | |
|---|---|---|---|---|---|---|---|---|---|---|
| 2800 | 100 | Yes | No | 0,7 | No | No | Tier-1 | 6.83 | Open an account Your capital is at risk. |
|
| 1200 | No | Yes | 0,1 | 0,6 | No | No | Tier-1 | 7.17 | Open an account Your capital is at risk.
|
|
| 129 | No | Yes | 0,15 | 0,3 | No | No | Tier-1 | 6.8 | Open an account Your capital is at risk. |
|
| 5500 | 100 | Yes | 0,2 | 1,0 | No | No | Tier-1 | 6.95 | Study review | |
| 30000 | No | Yes | 0,2 | 0,5 | No | Yes | Tier-1 | 6.9 | Open an account Your capital is at risk. |
What is a graphic pattern?
A graphic pattern is a visual representation of recurring price movements in financial markets, typically seen on price charts. Traders use these patterns to predict future price behavior by identifying formations such as triangles, head-and-shoulders, flags, and double tops. These patterns reflect market psychology, showing trends, reversals, and continuation signals that help traders make informed trading decisions.
Graphic patterns emerged with tools that track price movements on charts, forming a key part of technical analysis known as graphical analysis. While many patterns are speculative, some have become recognized classics after proving useful in market predictions.
Types of Forex chart patterns

Forex chart patterns fall into three primary categories: reversal patterns, continuation patterns, and bilateral patterns. Each type offers insights into potential market movements, aiding traders in making informed decisions.
1. Reversal Patterns
Reversal patterns signal that the current market trend is likely to change direction. They typically form when the market reaches a peak or trough, indicating that buyers or sellers are losing momentum. Traders use reversal patterns to anticipate when a bullish trend may turn bearish or vice versa. Examples include head and shoulders and double tops or bottoms.
2. Continuation Patterns
Continuation patterns suggest that the existing market trend will resume after a temporary pause or consolidation. They occur when traders take a break from intense buying or selling, leading to a price range before the trend continues. These patterns are crucial for traders looking to ride ongoing trends. Common examples include triangles and flags.
3. Bilateral Patterns
Bilateral patterns indicate market indecision, meaning the price could break out in either direction. Traders wait for confirmation before taking action, as these patterns reflect uncertainty. A breakout can signal the continuation of the current trend or a reversal, depending on market sentiment and external factors. A key example is the symmetrical triangle.
Technical patterns: pros and cons
Different technical patterns solve specific problems and suit various trading strategies and they depend on asset characteristics and chosen trading approaches. Core patterns exist but vary in usefulness based on the trading scenario. Below are the pros and cons of these patterns
- Pros
- Cons
- Visual clarity. Clearly identifiable on charts after indicator triggers and helps forecast potential price moves through recurring formations.
- Consistency. Formed by strict rules, ensuring reliability if conditions are met.
- Independence. No extra tools are needed — just use trendlines, support, and resistance levels.
- Time-tested. Proven methods with established rules for easy application.
- Decision efficiency. Speeds up the decision-making process with visible market signals.
- Subjectivity. Interpretation varies by experience level; novice traders may misread patterns.
- Complexity for beginners. Identifying non-standard formations can be challenging without trading experience.
Patterns vs. Indicators: What should you use?
Choosing between chart patterns and technical indicators in Forex trading depends on your trading style, goals, and market conditions. Chart patterns reveal market psychology by visually depicting price movements like head and shoulders, double tops, and triangles. These patterns excel at highlighting potential trend reversals, continuations, and breakouts, making them ideal for swing traders and long-term strategists. They require experience and interpretative skills, as their reliability depends on market context and trader proficiency.
On the other hand, technical indicators offer data-driven insights through mathematical calculations on price and volume data. Tools like moving averages, Relative Strength Index (RSI), and Bollinger Bands help identify trends, momentum, and potential reversals. Indicators provide precise entry and exit signals, reducing emotional trading decisions. However, they can produce lagging or false signals in volatile or choppy markets, requiring careful interpretation.
The most effective trading strategies combine both approaches. For example, a trader might use a moving average to confirm a trend while spotting a head and shoulders pattern for a potential reversal. This hybrid strategy leverages the strengths of both methods, enhancing market analysis and improving decision-making for more successful trades.
Use Fibonacci retracement levels after spotting patterns like Bullish Flags to find precise entry points

When learning Forex trading, don’t just memorize chart patterns — grasp what they reveal about market behavior. For example, the Head and Shoulders pattern isn’t merely a trend reversal clue; it reflects a struggle where buyers lose steam after repeated pushes. Pay close attention to falling trading volumes as the right shoulder forms — this often indicates that buyers are stepping back, hinting at a potential price drop. Don’t jump in just because you spot the pattern; wait until the price breaks below the neckline to confirm a true reversal.
Another smart approach is combining chart patterns with important economic events. A Double Top near a central bank announcement could be more impactful than during a quiet market. Use Fibonacci retracement levels after spotting patterns like Bullish Flags to find precise entry points. This strategy helps you enter trades at optimal levels rather than too early, improving your chances of making better returns.
Summary
Mastering Forex chart patterns such as the Head and Shoulders, Double Top, and Morning Star can enhance trading strategies by offering valuable insights into market trends and reversals. These patterns help traders spot potential price movements, optimize entry and exit points, and increase profitability when used with sound risk management strategies. Whether you're a beginner or a seasoned trader, recognizing and applying these patterns can significantly improve trading success.
FAQs
What is the most effective chart pattern in Forex?
The most effective chart pattern in Forex varies depending on the trader's experience and strategy. That being said, many traders have suggested that the Head and Shoulders pattern is considered highly reliable for identifying trend reversals.
What is the most successful chart pattern?
The most successful chart pattern is subjective and depends on individual trading styles. That being said, experts suggest that Head and Shoulders and Double Top/Bottom patterns are known for their high success rates in predicting trend reversals.
What is a 3-top Forex pattern?
A 3-top Forex pattern, also known as a Triple Top, is formed by three peaks reaching the same price level with pullbacks in between. This pattern typically signals a bearish trend reversal.
What are the most useful trading patterns?
According to experts, the most useful trading patterns include Head and Shoulders, Double Top/Bottom, Triple Top/Bottom, Harami, and Doji. These patterns provide valuable insights into potential trend reversals and continuations, helping traders make informed decisions.
Related Articles
Team that worked on the article
Peter Emmanuel Chijioke is a professional personal finance, Forex, crypto, blockchain, NFT, and Web3 writer and a contributor to the Traders Union website. As a computer science graduate with a robust background in programming, machine learning, and blockchain technology, he possesses a comprehensive understanding of software, technologies, cryptocurrency, and Forex trading.
Having skills in blockchain technology and over 7 years of experience in crafting technical articles on trading, software, and personal finance, he brings a unique blend of theoretical knowledge and practical expertise to the table. His skill set encompasses a diverse range of personal finance technologies and industries, making him a valuable asset to any team or project focused on innovative solutions, personal finance, and investing technologies.
Chinmay Soni is a financial analyst with more than 5 years of experience in working with stocks, Forex, derivatives, and other assets. As a founder of a boutique research firm and an active researcher, he covers various industries and fields, providing insights backed by statistical data. He is also an educator in the field of finance and technology.
As an author for Traders Union, he contributes his deep analytical insights on various topics, taking into account various aspects.
Mirjan Hipolito is a journalist and news editor at Traders Union. She is an expert crypto writer with five years of experience in the financial markets. Her specialties are daily market news, price predictions, and Initial Coin Offerings (ICO).
Algorithmic trading is an advanced method that relies on advanced coding and formulas based on a mathematical model. However, compared to traditional trading methods, the process differs by being automated.
Volatility refers to the degree of variation or fluctuation in the price or value of a financial asset, such as stocks, bonds, or cryptocurrencies, over a period of time. Higher volatility indicates that an asset's price is experiencing more significant and rapid price swings, while lower volatility suggests relatively stable and gradual price movements.
Forex trading, short for foreign exchange trading, is the practice of buying and selling currencies in the global foreign exchange market with the aim of profiting from fluctuations in exchange rates. Traders speculate on whether one currency will rise or fall in value relative to another currency and make trading decisions accordingly. However, beware that trading carries risks, and you can lose your whole capital.
Trade execution is knowing how to place and close trades at the right price. This is the key to turning your trading plans into real action and has a direct impact on your profits.
Day trading involves buying and selling financial assets within the same trading day, with the goal of profiting from short-term price fluctuations, and positions are typically not held overnight.


-
 Afghanistan
-
 Albania
-
 Algeria
-
 Argentina
-
 Armenia
-
 Australia
-
 Austria
-
 Azerbaijan
-
 Bahamas
-
 Bahrain
-
 Bangladesh
-
 Belgium
-
 Botswana
-
 Brazil
-
 Brunei
-
 Bulgaria
-
 Burma
Burma
-
 Cambodia
-
 Cameroon
-
 Canada
-
 Chile
Chile
-
 China
China
-
 Colombia
-
 Costa Rica
-
 Cote d'Ivoire
-
 Croatia
-
 Cyprus
-
 Czech Republic
-
 Denmark
-
 Dominican Republic
-
 Ecuador
-
 Egypt
Egypt
-
 Estonia
-
 Eswatini
-
 Ethiopia
-
 Finland
-
 France
-
 Georgia
-
 Germany
-
 Ghana
Ghana
-
 Greece
-
 Haiti
Haiti
-
 Hong Kong
-
 Hungary
-
 India
India
-
 Indonesia
-
 Iran, Islamic republic
-
 Iraq
Iraq
-
 Ireland
-
 Israel
-
 Italy
Italy
-
 Jamaica
-
 Japan
Japan
-
 Jordan
-
 Kazakhstan
-
 Kenya
Kenya
-
 Korea
Korea
-
 Kuwait
-
 Kyrgyzstan
-
 Laos
Laos
-
 Latvia
-
 Lebanon
-
 Libyan Arab Jamahiriya
-
 Lithuania
-
 Luxembourg
-
 Macedonia
-
 Madagascar
-
 Malaysia
-
 Malta
Malta
-
 Mauritius
-
 Mexico
-
 Moldova
-
 Mongolia
-
 Montenegro
-
 Morocco
-
 Mozambique
-
 Namibia
-
 Nepal
Nepal
-
 Netherlands
-
 Nigeria
-
 Norway
-
 Oman
Oman
-
 Pakistan
-
 Palestine
-
 Papua New Guinea
-
 Peru
Peru
-
 Philippines
-
 Poland
-
 Portugal
-
 Puerto Rico
-
 Qatar
Qatar
-
 Romania
-
 Rwanda
-
 Saudi Arabia
-
 Serbia
-
 Singapore
-
 Slovakia
-
 Slovenia
-
 Somalia
-
 South Africa
-
 Spain
Spain
-
 Sri Lanka
-
 Sweden
-
 Switzerland
-
 Syrian Arab Republic
-
 Taiwan
-
 Tajikistan
-
 Tanzania, United Republic Of
-
 Thailand
-
 Trinidad and Tobago
-
 Tunisia
-
 Turkey
-
 UAE
UAE
-
 Uganda
-
 Ukraine
-
 United Kingdom
-
United States
-
 Uzbekistan
-
 Venezuela
-
 Vietnam
-
 Yemen
Yemen
-
 Zambia
-
 Zimbabwe
- Forex
- Crypto
