
AMD stock price forecast: $400 support in play as AMD slips 1.88%

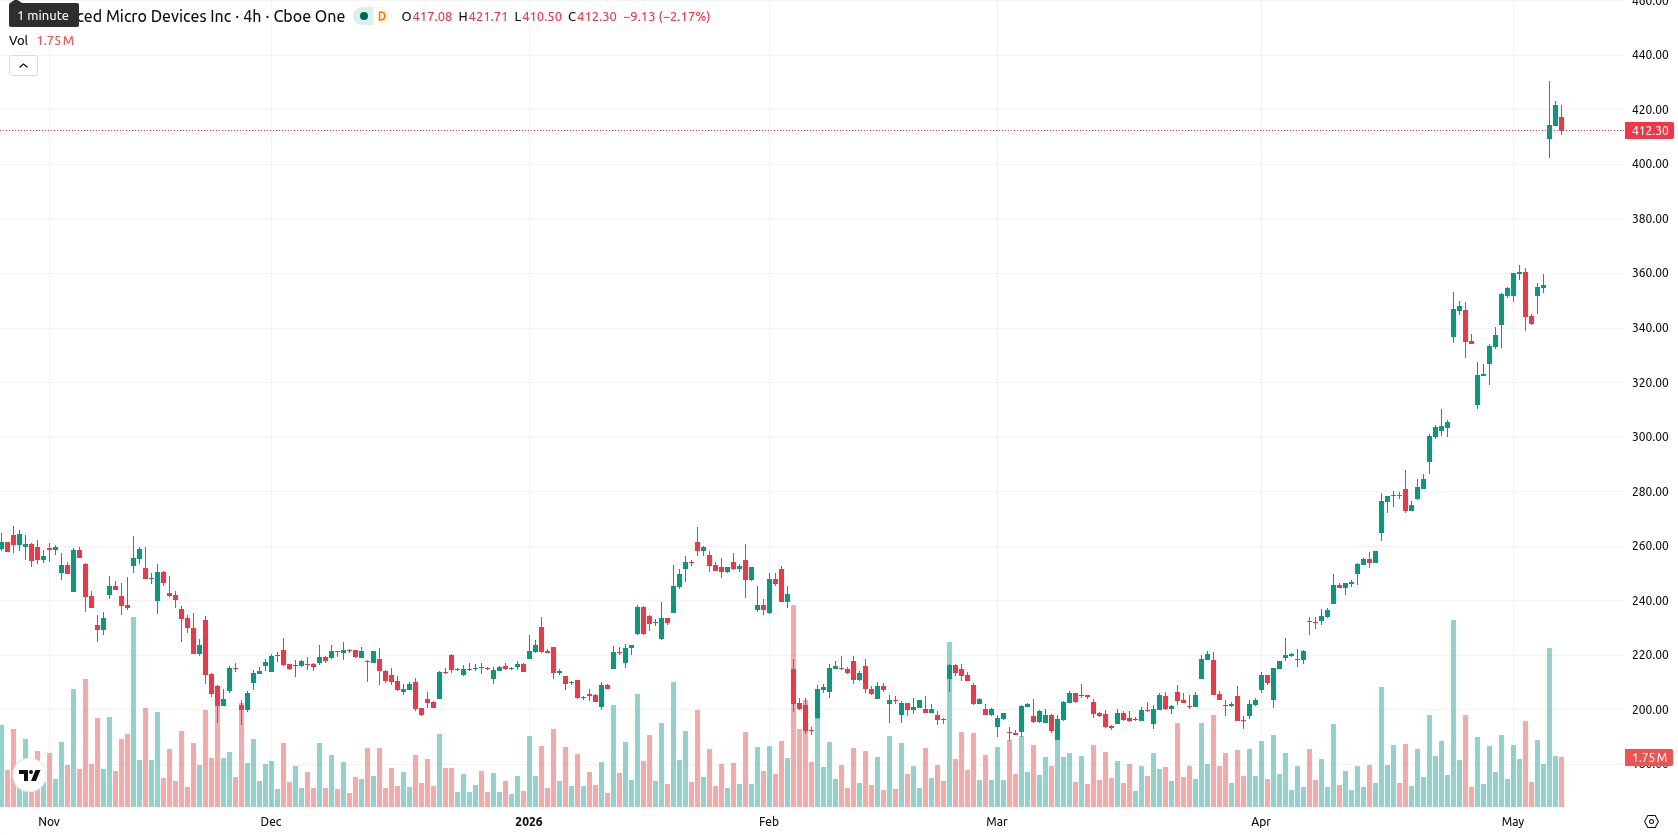
Advanced Micro Devices, Inc. (AMD) is trading at $411.27, posting a daily decline of 1.88%. The price remains well above its major moving averages, suggesting that the broader trend retains bullish characteristics despite the session's downward pressure.
Highlights
- AMD exceeded Q1 2026 expectations with strong data center and AI chip demand, posting a 57% rise in data center revenue.
- Management cited supply constraints—not demand—as the main growth limiter, supporting a raised Q2 outlook amid robust AI infrastructure investment.
- AMD trades in a strong uptrend but faces technical overbought signals, with a five-day range projected between $400 and $425 and high probability of near-term consolidation.
Earnings beat visibility rises as supply limits growth pace
AMD reported first quarter 2026 earnings on May 6 that exceeded expectations for both revenue and profit, reflecting robust realized demand for its AI and data center chips. Management indicated that supply constraints, not demand, now present the chief limitation on growth, with customer commitments extending production visibility. The company also raised second quarter guidance, attributing the improved outlook to accelerating AI infrastructure spend and a notable 57% increase in data center revenue, though price action has remained under broader selling pressure.
Overbought signals intensify as strong momentum faces exhaustion
Technically, AMD is trading with the price well above the SMA-20 at $307.03, SMA-50 at $245.49, and SMA-200 at $214.59. The Ichimoku Kijun stands at $313.33, serving as the nearest dynamic support. Momentum remains strong: MACD and ADX both confirm upward strength, and the Awesome Oscillator is positive. Yet, RSI at 80.84, Stoch RSI at 57.45, and CCI at 181.67 all register significant overbought conditions, while BBP at 93 points to ongoing buyer dominance intraday. The session opened with a small gap down and the price has traded near the session’s low, reflecting some short-term exhaustion within a moderately volatile range.
Upward bias persists as overbought risks suggest sideways trade
Looking ahead over the next five sessions, AMD is expected to fluctuate within a range of $400 to $425, capturing its typical volatility band relative to the current price. The probability of a further upward move remains high, supported by strong signals from MACD, ADX, and weekly trend indicators. However, the pronounced overbought conditions suggest that a period of sideways consolidation within this corridor is likely. Should the price decisively break above $425, bullish momentum could drive a sustained rally, while a sustained drop below $400 may indicate a near-term corrective phase.
Earlier, analysts noted that AMD was exhibiting sustained bullish momentum supported by strong demand for its AI and data center chips. The current market action reinforces this broader uptrend, but with heightened overbought conditions, traders should closely monitor for either a breakout above $425 or signs of a near-term pullback if the $400 support level falters.


Latest AMD News


-
 Afghanistan
-
 Albania
-
 Algeria
-
 Angola
-
 Argentina
-
 Armenia
-
 Australia
-
 Austria
-
 Azerbaijan
-
 Bahamas
-
 Bahrain
-
 Bangladesh
-
 Belarus
-
 Belgium
-
 Bolivia
-
 Botswana
-
 Brazil
-
 Brunei
-
 Bulgaria
-
 Cambodia
-
 Cameroon
-
 Canada
-
 Chile
Chile
-
 China
China
-
 Colombia
-
 Congo
Congo
-
 Costa Rica
-
 Cote d'Ivoire
-
 Croatia
-
 Cuba
Cuba
-
 Cyprus
-
 Czechia
-
 DR Congo
-
 Denmark
-
 Dominican Republic
-
 Ecuador
-
 Egypt
Egypt
-
 El Salvador
-
 Estonia
-
 Eswatini
-
 Ethiopia
-
 Finland
-
 France
-
 Georgia
-
 Germany
-
 Ghana
Ghana
-
 Greece
-
 Haiti
Haiti
-
 Hong Kong
-
 Hungary
-
 India
India
-
 Indonesia
-
 Iran, Islamic republic
-
 Iraq
Iraq
-
 Ireland
-
 Israel
-
 Italy
Italy
-
 Jamaica
-
 Japan
Japan
-
 Jordan
-
 Kazakhstan
-
 Kenya
Kenya
-
 Korea
Korea
-
 Kuwait
-
 Kyrgyzstan
-
 Laos
Laos
-
 Latvia
-
 Lebanon
-
 Lesotho
-
 Libya
Libya
-
 Lithuania
-
 Luxembourg
-
 Madagascar
-
 Malaysia
-
 Malta
Malta
-
 Mauritius
-
 Mexico
-
 Moldova
-
 Mongolia
-
 Montenegro
-
 Morocco
-
 Mozambique
-
 Myanmar
-
 Namibia
-
 Nepal
Nepal
-
 Netherlands
-
 New Zealand
-
 Nigeria
-
 North Macedonia
-
 Norway
-
 Oman
Oman
-
 Pakistan
-
 Palestine
-
 Panama
-
 Papua New Guinea
-
 Paraguay
-
 Peru
Peru
-
 Philippines
-
 Poland
-
 Portugal
-
 Puerto Rico
-
 Qatar
Qatar
-
 Reunion
-
 Romania
-
 Rwanda
-
 Saudi Arabia
-
 Serbia
-
 Singapore
-
 Slovakia
-
 Slovenia
-
 Somalia
-
 South Africa
-
 Spain
Spain
-
 Sri Lanka
-
 Sweden
-
 Switzerland
-
 Syria
Syria
-
 Taiwan
-
 Tajikistan
-
 Tanzania
-
 Thailand
-
 Trinidad and Tobago
-
 Tunisia
-
 Turkey
-
 UAE
UAE
-
 Uganda
-
 Ukraine
-
 United Kingdom
-
United States
-
 Uruguay
-
 Uzbekistan
-
 Venezuela
-
 Vietnam
-
 Yemen
Yemen
-
 Zambia
-
 Zimbabwe
- Forex
- Crypto
