
Solana price prediction: Stuck between resistance and support? SOL consolidates near $144

Solana (SOL) is trading at $144.16, holding above the MA-20 ($136.16) but below the MA-50 ($161.39) and well under the MA-200 ($177.95), indicating a short-term bullish undertone with medium- and long-term resistance still in place. The immediate dynamic resistance is at the Ichimoku Kijun level ($146.80), while support is near MA-20 ($136.16).
SOL price prediction
Current price:
$ 73.01
3.3
4.73%
Real-time Data
01:20
Daily range
73.02
 73.32
73.32
Weekly range
67.92
76.09
Loading...
Highlights
- Franklin Templeton launched the Solana ETF (SOEZ) on NYSE Arca, offering regulated SOL exposure with built-in staking features.
- Multiple major asset managers are introducing Solana ETF products, reflecting accelerating institutional demand for SOL exposure.
- Recent months have seen increased institutional inflows and rising on-chain activity, including higher Total Value Locked in DeFi and greater spot and futures market liquidity.
Institutional inflows rise as Solana ETF launches drive demand
Franklin Templeton has launched a Solana ETF (SOEZ) on NYSE Arca, giving investors regulated access to SOL with staking features. This ETF launch comes amid several new Solana ETF products from major asset managers, signaling institutional demand for the asset. Recent months have also seen rising institutional inflows and increased on-chain activity, such as higher Total Value Locked in DeFi and greater liquidity in spot and futures markets.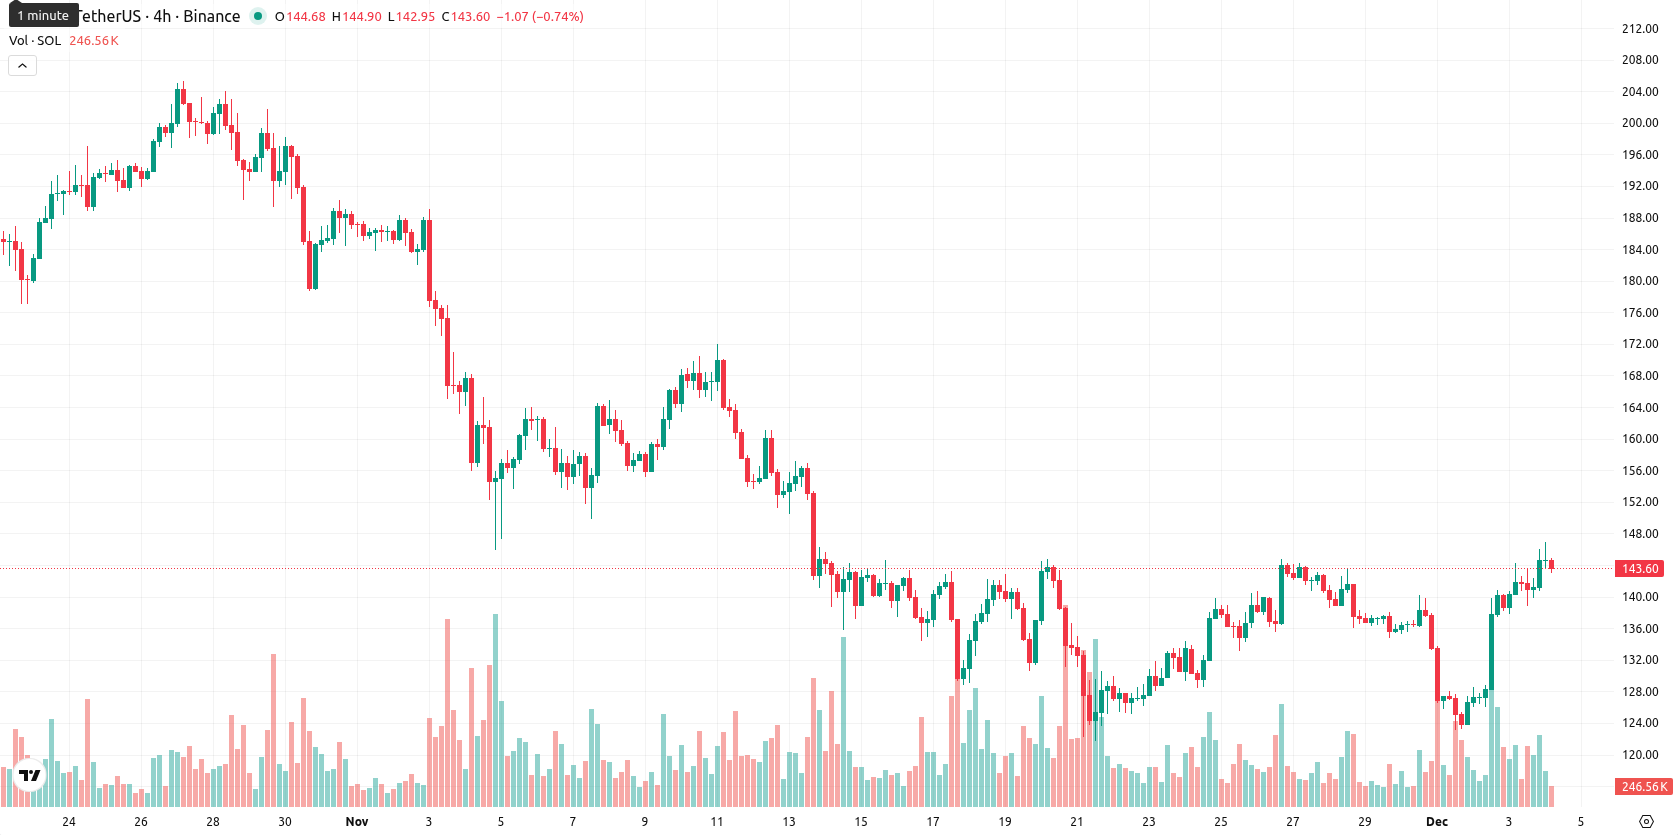
Mixed momentum and overbought signals as price consolidates mid-range
Momentum signals are mixed: daily MACD shows strong selling pressure and ADX reflects a firm trend, while RSI is neutral near 50. Stoch RSI and CCI signal overbought conditions, and the Bull/Bear Power indicates buyers dominate today’s action. Awesome Oscillator is neutral and does not clearly support the prevailing bias. Today’s session opened with a small upward gap and is currently trading mid-range between $142.96 and $146.75, with modest daily volatility and a tendency for sideways consolidation after a muted move (up 0.34%).Bearish scenario favored as weekly momentum points to downside risk
For the coming week, the expected price range is $130 to $150, adjusted for current volatility and to remain within 10% of the latest traded price. The probability of further price increases is very low (less than 20%), making a decline more likely, based on predominantly bearish weekly momentum and moving averages. In the baseline scenario, SOL trades sideways between local support ($136–$138) and resistance ($146–$150). A bullish development would require a break and hold above $150, clearing resistance at Kijun and MA-50, while a bearish scenario could see a slide toward $130 if support fails.
Viktoras Karapetjanc, Traders Union expert, sees Solana’s short-term outlook as supported by the launch of the Franklin Templeton ETF and visible institutional interest. He believes underlying sentiment remains constructive, with buyers showing strength and new products fueling longer-term confidence. While momentum signals are mixed and technical resistance is close, the analyst expects sideways action unless $150 is cleared. His fundamental and sentiment view tilts positive on regulated adoption, even as consolidation may continue. "A decisive break above $150 would signal growing optimism and could trigger a new bullish phase for SOL."
Previously it was reported that Solana demonstrated strong short-term momentum by trading above the MA-20 but remained under pressure below the MA-50 and MA-200, with mixed technical signals as the daily MACD stayed negative and RSI reflected fading strength. Resistance was noted near the MA-50 and key Ichimoku levels, while price volatility increased and a sharp 12.92% daily gain highlighted heightened buyer activity despite a predominantly bearish medium-term outlook.
Source of Data:
SOL Price Analysis by TU
The analysis is based on a proprietary model combining technical, on-chain, and expert data. Not investment advice. See
methodology
The information is based on forecasts and does not constitute investment advice or a guarantee of future results. Market conditions may change. See our Disclaimer and Editorial Integrity for details.
Subscribe to TU news

Did you like the article?


Latest Solana News


Weekly Top Bonuses

Top News


Top 5 companies for you

United States
-
 Afghanistan
-
 Albania
-
 Algeria
-
 Angola
-
 Argentina
-
 Armenia
-
 Australia
-
 Austria
-
 Azerbaijan
-
 Bahamas
-
 Bahrain
-
 Bangladesh
-
 Belarus
-
 Belgium
-
 Bolivia
-
 Botswana
-
 Brazil
-
 Brunei
-
 Bulgaria
-
 Cambodia
-
 Cameroon
-
 Canada
-
 Chile
Chile
-
 China
China
-
 Colombia
-
 Congo
Congo
-
 Costa Rica
-
 Cote d'Ivoire
-
 Croatia
-
 Cuba
Cuba
-
 Cyprus
-
 Czechia
-
 DR Congo
-
 Denmark
-
 Dominican Republic
-
 Ecuador
-
 Egypt
Egypt
-
 El Salvador
-
 Estonia
-
 Eswatini
-
 Ethiopia
-
 Finland
-
 France
-
 Georgia
-
 Germany
-
 Ghana
Ghana
-
 Greece
-
 Haiti
Haiti
-
 Hong Kong
-
 Hungary
-
 India
India
-
 Indonesia
-
 Iran, Islamic republic
-
 Iraq
Iraq
-
 Ireland
-
 Israel
-
 Italy
Italy
-
 Jamaica
-
 Japan
Japan
-
 Jordan
-
 Kazakhstan
-
 Kenya
Kenya
-
 Korea
Korea
-
 Kuwait
-
 Kyrgyzstan
-
 Laos
Laos
-
 Latvia
-
 Lebanon
-
 Lesotho
-
 Libya
Libya
-
 Lithuania
-
 Luxembourg
-
 Madagascar
-
 Malaysia
-
 Malta
Malta
-
 Mauritius
-
 Mexico
-
 Moldova
-
 Mongolia
-
 Montenegro
-
 Morocco
-
 Mozambique
-
 Myanmar
-
 Namibia
-
 Nepal
Nepal
-
 Netherlands
-
 New Zealand
-
 Nigeria
-
 North Macedonia
-
 Norway
-
 Oman
Oman
-
 Pakistan
-
 Palestine
-
 Panama
-
 Papua New Guinea
-
 Paraguay
-
 Peru
Peru
-
 Philippines
-
 Poland
-
 Portugal
-
 Puerto Rico
-
 Qatar
Qatar
-
 Reunion
-
 Romania
-
 Rwanda
-
 Saudi Arabia
-
 Serbia
-
 Singapore
-
 Slovakia
-
 Slovenia
-
 Somalia
-
 South Africa
-
 Spain
Spain
-
 Sri Lanka
-
 Sweden
-
 Switzerland
-
 Syria
Syria
-
 Taiwan
-
 Tajikistan
-
 Tanzania
-
 Thailand
-
 Trinidad and Tobago
-
 Tunisia
-
 Turkey
-
 UAE
UAE
-
 Uganda
-
 Ukraine
-
 United Kingdom
-
United States
-
 Uruguay
-
 Uzbekistan
-
 Venezuela
-
 Vietnam
-
 Yemen
Yemen
-
 Zambia
-
 Zimbabwe
- Forex
- Crypto
Live News
