
Tezos: mixed technical signals fuel 9.32% jump within a volatile band

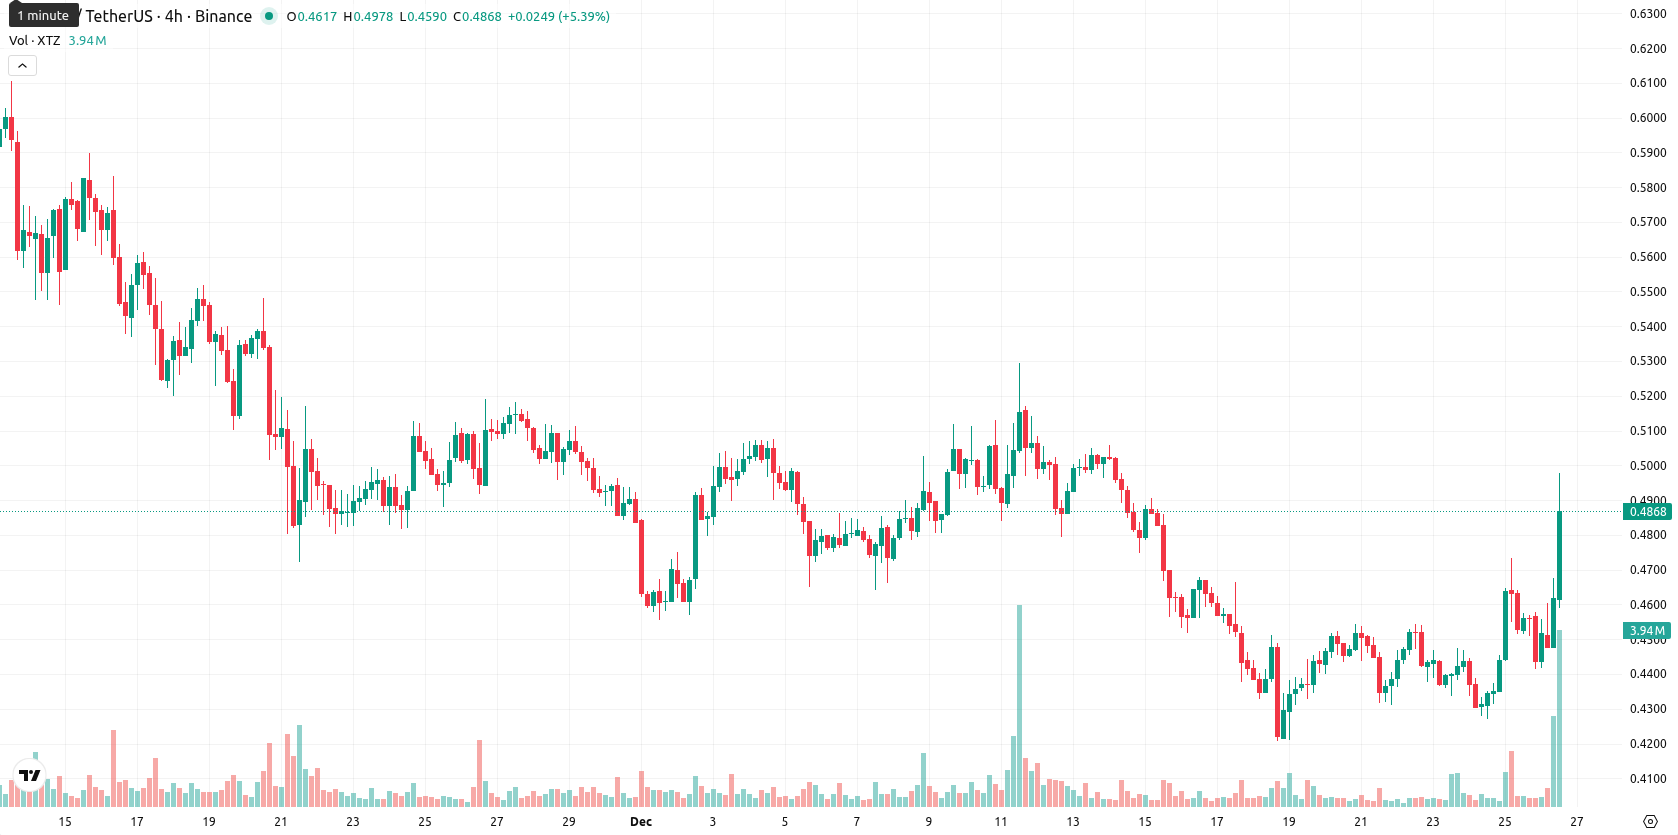
Tezos (XTZ) is currently trading above the MA-20 ($0.4670) but just below the MA-50 ($0.5102), reflecting a 9.32% surge today and short-term bullish momentum within a volatile daily range. Despite this upside, the medium-term trend remains constrained by dynamic resistance and broader bearish signals at higher timeframes.
Highlights
- XTZ surged 9.32% to $0.4971, trading above the MA-20 ($0.4670) but below the MA-50 ($0.5102), indicating short-term bullish momentum amid medium-term resistance.
- Momentum signals are mixed, with MACD in a strong sell phase, ADX showing a weak trend, RSI at 46.3 neutral, and Stoch RSI signaling overbought conditions.
- Weekly technicals project a normalized price range of $0.4500 to $0.5200 with less than 20% probability of further gains, favoring sideways or downward price movement.
Mixed momentum and weak trend as price nears resistance barriers
XTZ is tracking above the 20-day moving average ($0.4670), but faces resistance at the MA-50 ($0.5102), with the Ichimoku Kijun at $0.4750 now acting as nearby support. The price remains well below the MA-200 ($0.6451), suggesting longer-term bearish pressure. Momentum signals are mixed: MACD is in a strong sell phase, ADX signals a weak trend, RSI sits neutral at 46.3, while Stoch RSI points to overbought conditions. Bull/Bear Power at 0.0265 reflects mild intraday buyer dominance, and the Awesome Oscillator is neutral, suggesting recent buying strength is not yet matched by a clear directional trend.
Sideways movement favored as upside probability remains constrained
In the short term, XTZ is expected to trade in a typical volatility band between $0.4500 and $0.5200. A break above $0.5200 would likely result in a bullish extension, while a drop below $0.4500 could see the price return to lower support areas. Weekly technical indicators point to a low probability (less than 20%) of further gains, with sideways movement favored within the established price range.
Previously it was reported that Tezos is trading above its short-term moving average but remains below key medium- and long-term averages, indicating short-term bullish momentum within an overall bearish market structure. While near-term support and resistance levels are defined by the Ichimoku Kijun and MA-50, most technical indicators including MACD, ADX, and RSI highlight weak or negative momentum, with session volatility and mixed signals suggesting further consolidation.


-
 Afghanistan
-
 Albania
-
 Algeria
-
 Angola
-
 Argentina
-
 Armenia
-
 Australia
-
 Austria
-
 Azerbaijan
-
 Bahamas
-
 Bahrain
-
 Bangladesh
-
 Belarus
-
 Belgium
-
 Bolivia
-
 Botswana
-
 Brazil
-
 Brunei
-
 Bulgaria
-
 Cambodia
-
 Cameroon
-
 Canada
-
 Chile
Chile
-
 China
China
-
 Colombia
-
 Congo
Congo
-
 Costa Rica
-
 Cote d'Ivoire
-
 Croatia
-
 Cuba
Cuba
-
 Cyprus
-
 Czechia
-
 DR Congo
-
 Denmark
-
 Dominican Republic
-
 Ecuador
-
 Egypt
Egypt
-
 El Salvador
-
 Estonia
-
 Eswatini
-
 Ethiopia
-
 Finland
-
 France
-
 Georgia
-
 Germany
-
 Ghana
Ghana
-
 Greece
-
 Haiti
Haiti
-
 Hong Kong
-
 Hungary
-
 India
India
-
 Indonesia
-
 Iran, Islamic republic
-
 Iraq
Iraq
-
 Ireland
-
 Israel
-
 Italy
Italy
-
 Jamaica
-
 Japan
Japan
-
 Jordan
-
 Kazakhstan
-
 Kenya
Kenya
-
 Korea
Korea
-
 Kuwait
-
 Kyrgyzstan
-
 Laos
Laos
-
 Latvia
-
 Lebanon
-
 Lesotho
-
 Libya
Libya
-
 Lithuania
-
 Luxembourg
-
 Madagascar
-
 Malaysia
-
 Malta
Malta
-
 Mauritius
-
 Mexico
-
 Moldova
-
 Mongolia
-
 Montenegro
-
 Morocco
-
 Mozambique
-
 Myanmar
-
 Namibia
-
 Nepal
Nepal
-
 Netherlands
-
 New Zealand
-
 Nigeria
-
 North Macedonia
-
 Norway
-
 Oman
Oman
-
 Pakistan
-
 Palestine
-
 Panama
-
 Papua New Guinea
-
 Paraguay
-
 Peru
Peru
-
 Philippines
-
 Poland
-
 Portugal
-
 Puerto Rico
-
 Qatar
Qatar
-
 Reunion
-
 Romania
-
 Rwanda
-
 Saudi Arabia
-
 Serbia
-
 Singapore
-
 Slovakia
-
 Slovenia
-
 Somalia
-
 South Africa
-
 Spain
Spain
-
 Sri Lanka
-
 Sweden
-
 Switzerland
-
 Syria
Syria
-
 Taiwan
-
 Tajikistan
-
 Tanzania
-
 Thailand
-
 Trinidad and Tobago
-
 Tunisia
-
 Turkey
-
 UAE
UAE
-
 Uganda
-
 Ukraine
-
 United Kingdom
-
United States
-
 Uruguay
-
 Uzbekistan
-
 Venezuela
-
 Vietnam
-
 Yemen
Yemen
-
 Zambia
-
 Zimbabwe
- Forex
- Crypto
