
Tezos price prediction: $0.25296282 resistance in focus as XTZ rises 6.62%

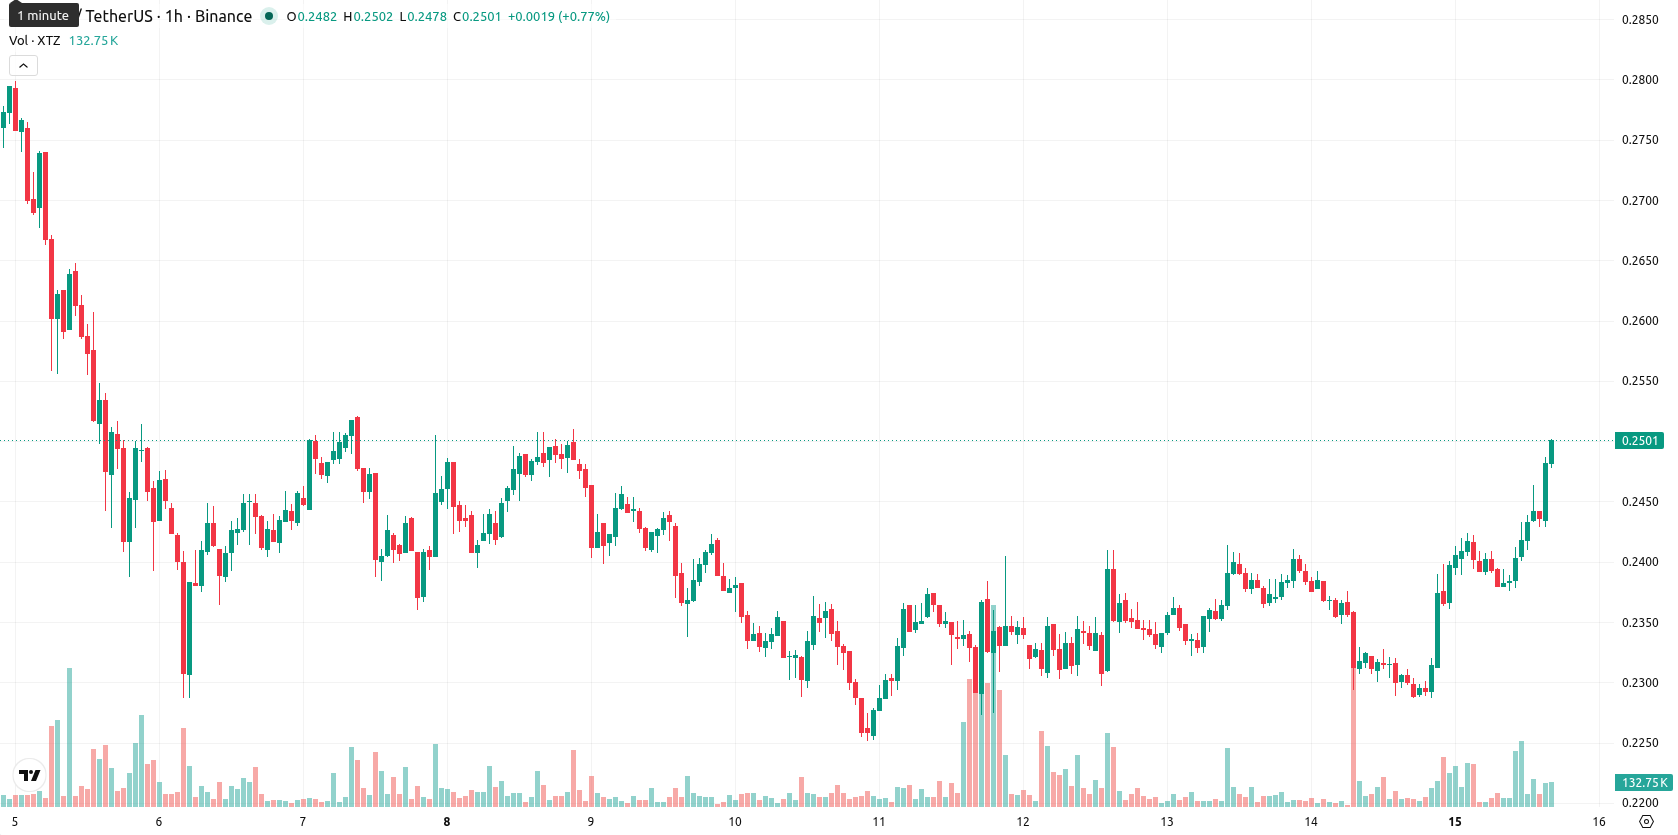
Tezos (XTZ) is trading at $0.2482 after a strong session, posting a 6.62% gain for the day. The asset remains above its key short-term moving averages but continues to lag far below long-term trend levels.
Highlights
- XTZ/USD trades with strong intraday momentum, posting a 6.62% gain and reaching session highs amid heavy buying.
- Technical indicators signal a bullish short-term trend, but multiple overbought readings point to possible near-term exhaustion.
- Price is projected to stay within the $0.24190000–$0.25296282 range over the next 2–3 days, with minimal downside risk.
Overbought signals intensify as bullish momentum meets resistance bands
On the technical front, XTZ/USD is trading above the MA-20 ($0.23990500) and MA-50 ($0.23674800) on the 1-hour chart, while remaining well below the MA-200 ($0.41329250). The Ichimoku Kijun level, located at $0.23970000, acts as immediate support. Bullish momentum is confirmed by signals from MACD, ADX, BBP, and the Awesome Oscillator. The RSI prints 69.42, indicating a strong buy but approaching overbought territory. Both the Stoch RSI and CCI also highlight overbought conditions, and the price is trading near the session high. Heightened volatility and persistent bullish momentum suggest further upside is possible, but traders should monitor for exhaustion signals as several oscillators remain overbought.
Upside probability rises as volatility underpins consolidation range
Over the next 2–3 trading days, XTZ/USD is expected to fluctuate within the $0.24190000 to $0.25296282 range, consistent with the asset's current volatility band. There is a very high probability of further upward movement, while the chances of a pronounced downward reversal are considered very low. The baseline scenario calls for consolidation within the stated range. In a bullish scenario, sustained buying could propel the price above resistance to extend gains, while in the bearish case, a break below immediate support may lead to a sharper retracement.
Earlier, analysts noted that Tezos was exhibiting positive momentum but remained constrained by longer-term technical resistance, with expectations of range-bound movement prevailing. The latest price action strengthens this view, with persistent bullish momentum now accompanied by heightened overbought signals and volatility, making the risk of a short-term pullback from current highs an important factor for traders to monitor.


-
 Afghanistan
-
 Albania
-
 Algeria
-
 Angola
-
 Argentina
-
 Armenia
-
 Australia
-
 Austria
-
 Azerbaijan
-
 Bahamas
-
 Bahrain
-
 Bangladesh
-
 Belarus
-
 Belgium
-
 Bolivia
-
 Botswana
-
 Brazil
-
 Brunei
-
 Bulgaria
-
 Cambodia
-
 Cameroon
-
 Canada
-
 Chile
Chile
-
 China
China
-
 Colombia
-
 Congo
Congo
-
 Costa Rica
-
 Cote d'Ivoire
-
 Croatia
-
 Cuba
Cuba
-
 Cyprus
-
 Czechia
-
 DR Congo
-
 Denmark
-
 Dominican Republic
-
 Ecuador
-
 Egypt
Egypt
-
 El Salvador
-
 Estonia
-
 Eswatini
-
 Ethiopia
-
 Finland
-
 France
-
 Georgia
-
 Germany
-
 Ghana
Ghana
-
 Greece
-
 Haiti
Haiti
-
 Hong Kong
-
 Hungary
-
 India
India
-
 Indonesia
-
 Iran, Islamic republic
-
 Iraq
Iraq
-
 Ireland
-
 Israel
-
 Italy
Italy
-
 Jamaica
-
 Japan
Japan
-
 Jordan
-
 Kazakhstan
-
 Kenya
Kenya
-
 Korea
Korea
-
 Kuwait
-
 Kyrgyzstan
-
 Laos
Laos
-
 Latvia
-
 Lebanon
-
 Lesotho
-
 Libya
Libya
-
 Lithuania
-
 Luxembourg
-
 Madagascar
-
 Malaysia
-
 Malta
Malta
-
 Mauritius
-
 Mexico
-
 Moldova
-
 Mongolia
-
 Montenegro
-
 Morocco
-
 Mozambique
-
 Myanmar
-
 Namibia
-
 Nepal
Nepal
-
 Netherlands
-
 New Zealand
-
 Nigeria
-
 North Macedonia
-
 Norway
-
 Oman
Oman
-
 Pakistan
-
 Palestine
-
 Panama
-
 Papua New Guinea
-
 Paraguay
-
 Peru
Peru
-
 Philippines
-
 Poland
-
 Portugal
-
 Puerto Rico
-
 Qatar
Qatar
-
 Reunion
-
 Romania
-
 Rwanda
-
 Saudi Arabia
-
 Serbia
-
 Singapore
-
 Slovakia
-
 Slovenia
-
 Somalia
-
 South Africa
-
 Spain
Spain
-
 Sri Lanka
-
 Sweden
-
 Switzerland
-
 Syria
Syria
-
 Taiwan
-
 Tajikistan
-
 Tanzania
-
 Thailand
-
 Trinidad and Tobago
-
 Tunisia
-
 Turkey
-
 UAE
UAE
-
 Uganda
-
 Ukraine
-
 United Kingdom
-
United States
-
 Uruguay
-
 Uzbekistan
-
 Venezuela
-
 Vietnam
-
 Yemen
Yemen
-
 Zambia
-
 Zimbabwe
- Forex
- Crypto
