
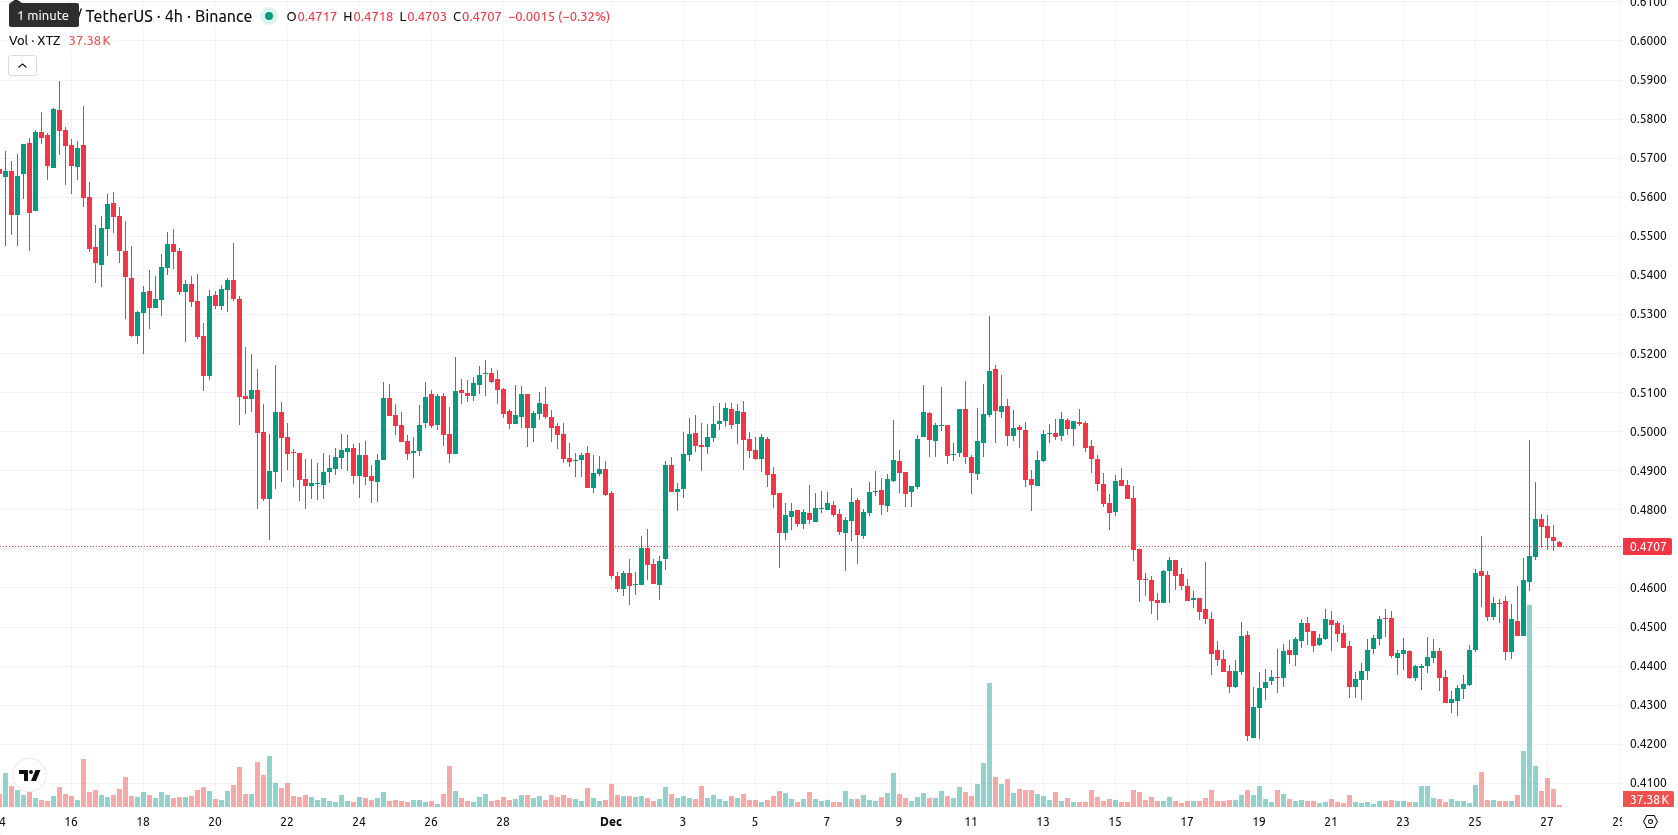
Tezos price prediction: Can volatility break resistance? XTZ gains 7.14%

Tezos (XTZ) is trading at $0.4815, which is above the MA-20 ($0.4665) but remains below both the MA-50 ($0.5076) and MA-200 ($0.6445). This setup suggests short-term bullish momentum amid ongoing medium- and long-term resistance.
Highlights
- XTZ trades at $0.4815, above the MA-20 ($0.4665) but below the MA-50 ($0.5076) and MA-200 ($0.6445), reflecting short-term bullish momentum facing medium- and long-term resistance.
- Momentum indicators are mixed: ADX (22.3) and RSI (54.7) show modest bullish tone, while MACD indicates strong sell pressure and Stoch RSI is fully overbought.
- XTZ's expected range for the coming week is $0.465–$0.495 with less than 20% probability of a price increase, favoring sideways consolidation or possible decline.
Volatility rises as conflicting momentum signals challenge bullish tone
Momentum indicators give mixed signals: ADX (22.3) shows a modest positive trend, while MACD on the daily chart signals strong sell pressure. RSI (54.7) stays in bullish territory, but Stoch RSI reads fully overbought and CCI is neutral. BBP indicates buyers dominate, but the Awesome Oscillator does not confirm an uptrend. The nearest dynamic support is currently near the Ichimoku Kijun at $0.4750 and the next resistance is at the MA-50, reflecting increased volatility and a sustained upward tone after the open.
Downside favored as breakout risks and consolidation shape outlook
For the coming week, the typical volatility band relative to current levels is expected between $0.465 and $0.495. The probability of a price increase is very low (less than 20%), making a decline more likely. The baseline scenario is for XTZ to consolidate sideways within this corridor, while a bullish breakout above $0.5076 targets higher levels and a move below $0.4750 could expose the price to further downside toward the lower range.
Last time, analysts noted that Tezos (XTZ) was exhibiting short-term bullish momentum above the 20-day moving average, but remained below longer-term moving averages, indicating an overall bearish trend. Key momentum indicators were mixed, with weak or negative signals from the MACD and ADX, overbought conditions on the Stoch RSI, and resistance seen at the MA-50 limiting further upside despite recent price gains.


-
 Afghanistan
-
 Albania
-
 Algeria
-
 Angola
-
 Argentina
-
 Armenia
-
 Australia
-
 Austria
-
 Azerbaijan
-
 Bahamas
-
 Bahrain
-
 Bangladesh
-
 Belarus
-
 Belgium
-
 Bolivia
-
 Botswana
-
 Brazil
-
 Brunei
-
 Bulgaria
-
 Cambodia
-
 Cameroon
-
 Canada
-
 Chile
Chile
-
 China
China
-
 Colombia
-
 Congo
Congo
-
 Costa Rica
-
 Cote d'Ivoire
-
 Croatia
-
 Cuba
Cuba
-
 Cyprus
-
 Czechia
-
 DR Congo
-
 Denmark
-
 Dominican Republic
-
 Ecuador
-
 Egypt
Egypt
-
 El Salvador
-
 Estonia
-
 Eswatini
-
 Ethiopia
-
 Finland
-
 France
-
 Georgia
-
 Germany
-
 Ghana
Ghana
-
 Greece
-
 Haiti
Haiti
-
 Hong Kong
-
 Hungary
-
 India
India
-
 Indonesia
-
 Iran, Islamic republic
-
 Iraq
Iraq
-
 Ireland
-
 Israel
-
 Italy
Italy
-
 Jamaica
-
 Japan
Japan
-
 Jordan
-
 Kazakhstan
-
 Kenya
Kenya
-
 Korea
Korea
-
 Kuwait
-
 Kyrgyzstan
-
 Laos
Laos
-
 Latvia
-
 Lebanon
-
 Lesotho
-
 Libya
Libya
-
 Lithuania
-
 Luxembourg
-
 Madagascar
-
 Malaysia
-
 Malta
Malta
-
 Mauritius
-
 Mexico
-
 Moldova
-
 Mongolia
-
 Montenegro
-
 Morocco
-
 Mozambique
-
 Myanmar
-
 Namibia
-
 Nepal
Nepal
-
 Netherlands
-
 New Zealand
-
 Nigeria
-
 North Macedonia
-
 Norway
-
 Oman
Oman
-
 Pakistan
-
 Palestine
-
 Panama
-
 Papua New Guinea
-
 Paraguay
-
 Peru
Peru
-
 Philippines
-
 Poland
-
 Portugal
-
 Puerto Rico
-
 Qatar
Qatar
-
 Reunion
-
 Romania
-
 Rwanda
-
 Saudi Arabia
-
 Serbia
-
 Singapore
-
 Slovakia
-
 Slovenia
-
 Somalia
-
 South Africa
-
 Spain
Spain
-
 Sri Lanka
-
 Sweden
-
 Switzerland
-
 Syria
Syria
-
 Taiwan
-
 Tajikistan
-
 Tanzania
-
 Thailand
-
 Trinidad and Tobago
-
 Tunisia
-
 Turkey
-
 UAE
UAE
-
 Uganda
-
 Ukraine
-
 United Kingdom
-
United States
-
 Uruguay
-
 Uzbekistan
-
 Venezuela
-
 Vietnam
-
 Yemen
Yemen
-
 Zambia
-
 Zimbabwe
- Forex
- Crypto
