
Celestia jumps 8.27% as intraday buyers push price above short-term average

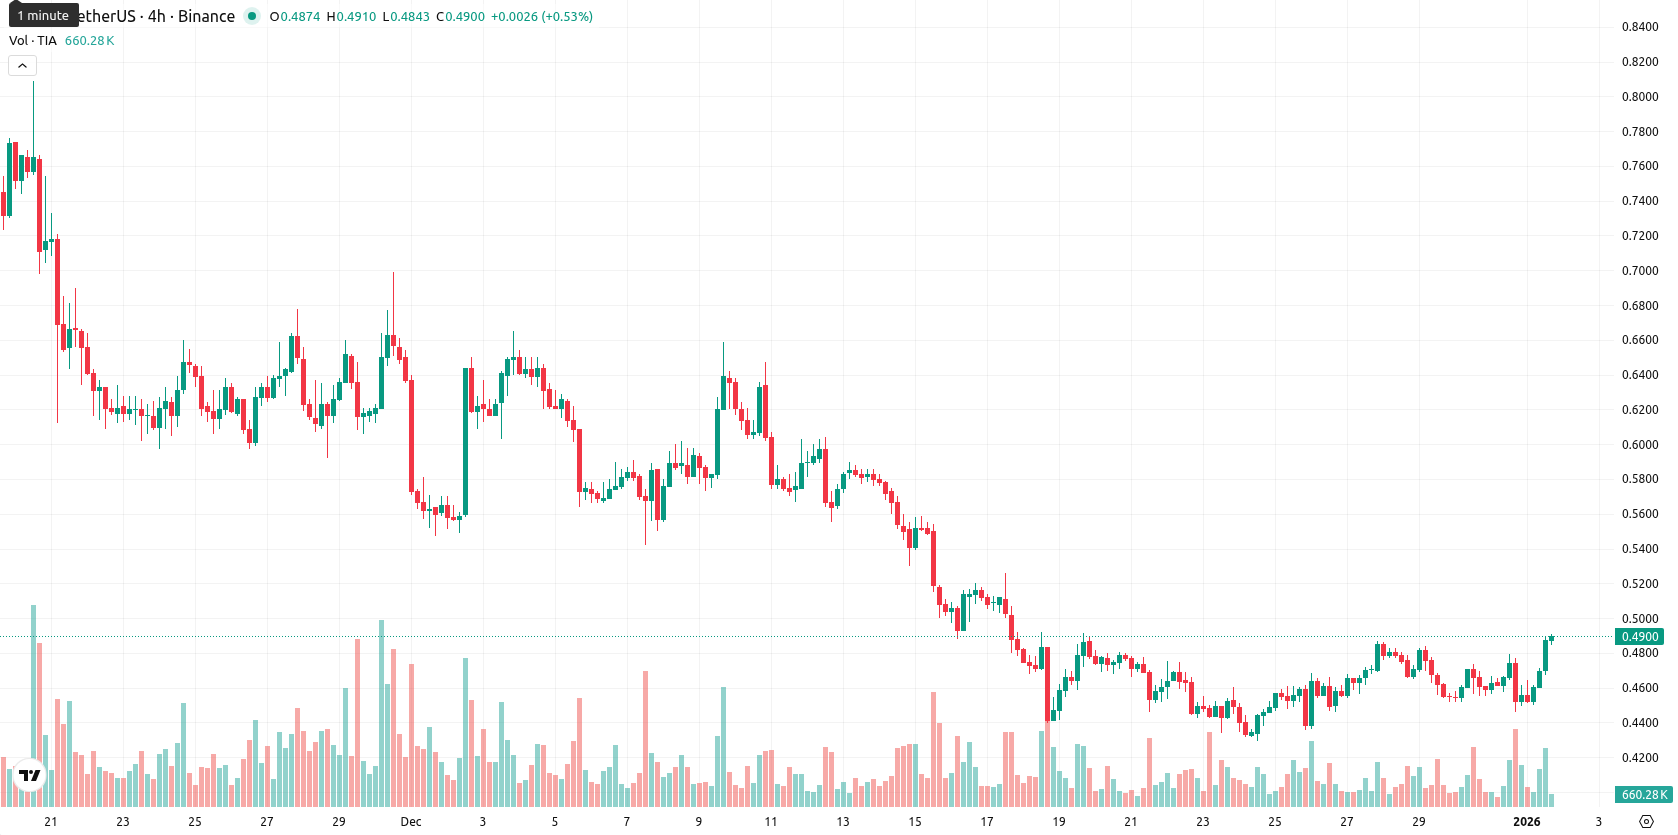
Celestia (TIA) is trading at $0.487, just above its MA-20 ($0.4811) but remains below both the MA-50 ($0.5993) and MA-200 ($1,3015). This setup reflects modest short-term relief; however, the medium- and longer-term trends are still under significant bearish pressure.
Highlights
- Celestia's 24-hour trading volume surged to $30.21 million, reflecting improved market activity and heightened investor participation.
- The asset remains confined within a defined trading range, with the lower boundary continuing to act as a support level.
- Recent price action places Celestia among mid-cap crypto assets showing gradual recovery alongside rising trading volumes.
Trading volume increase and range support bolster mid-cap recovery
Celestia saw an increase in 24-hour trading volume to $30.21 million, signaling improved market activity. The asset remains within a defined trading range with the lower boundary offering ongoing support. Recent movements place Celestia among mid-cap crypto assets experiencing gradual recovery and increased trading volume.
Bearish momentum persists despite daily gains and resistance at Kijun line
Technically, TIA's main resistance level is the Kijun line from Ichimoku at $0.5441, which acts as the nearest dynamic barrier for further upside. Momentum indicators on the daily chart are mostly bearish, with MACD and ADX confirming downside pressure, while RSI at 37.2 and neutral CCI at -47.0 reflect trading in a lower range rather than an oversold zone. Stoch RSI presents a sell reading near 70.2, signaling a potential pause in downward momentum, while BBP is slightly positive at 0.0081 and suggests an intraday buyer advantage. Despite a strong 8.27% daily gain and volatility toward the top of the session range ($0.4502 – $0.4885), broader trend indicators point to sustained bearish momentum.
Low upside odds as weekly signals favor further range-bound downside
Over the next five trading days, TIA is expected to remain within a typical volatility band relative to current levels, between $0.445 and $0.495. The probability of a price increase is very low (less than 20%), while a decline is more likely, based on unanimous sell signals from weekly momentum and trend indicators. Most scenarios point toward sideways movement within the $0.445 support and $0.495 resistance corridor. Any decisive break above $0.495 could lead to a move toward $0.544, whereas a close below $0.445 may signal another test of last week's low.
Previously it was reported that Celestia (TIA) continues to trade well below its key moving averages, with momentum and oscillators confirming strong bearish pressure and oversold conditions. Immediate resistance is defined by the Kijun level at $0.5885, while sellers remain in control and the probability of further downside is elevated barring a significant shift in market dynamics.


Latest Celestia News


-
 Afghanistan
-
 Albania
-
 Algeria
-
 Angola
-
 Argentina
-
 Armenia
-
 Australia
-
 Austria
-
 Azerbaijan
-
 Bahamas
-
 Bahrain
-
 Bangladesh
-
 Belarus
-
 Belgium
-
 Bolivia
-
 Botswana
-
 Brazil
-
 Brunei
-
 Bulgaria
-
 Cambodia
-
 Cameroon
-
 Canada
-
 Chile
Chile
-
 China
China
-
 Colombia
-
 Congo
Congo
-
 Costa Rica
-
 Cote d'Ivoire
-
 Croatia
-
 Cuba
Cuba
-
 Cyprus
-
 Czechia
-
 DR Congo
-
 Denmark
-
 Dominican Republic
-
 Ecuador
-
 Egypt
Egypt
-
 El Salvador
-
 Estonia
-
 Eswatini
-
 Ethiopia
-
 Finland
-
 France
-
 Georgia
-
 Germany
-
 Ghana
Ghana
-
 Greece
-
 Haiti
Haiti
-
 Hong Kong
-
 Hungary
-
 India
India
-
 Indonesia
-
 Iran, Islamic republic
-
 Iraq
Iraq
-
 Ireland
-
 Israel
-
 Italy
Italy
-
 Jamaica
-
 Japan
Japan
-
 Jordan
-
 Kazakhstan
-
 Kenya
Kenya
-
 Korea
Korea
-
 Kuwait
-
 Kyrgyzstan
-
 Laos
Laos
-
 Latvia
-
 Lebanon
-
 Lesotho
-
 Libya
Libya
-
 Lithuania
-
 Luxembourg
-
 Madagascar
-
 Malaysia
-
 Malta
Malta
-
 Mauritius
-
 Mexico
-
 Moldova
-
 Mongolia
-
 Montenegro
-
 Morocco
-
 Mozambique
-
 Myanmar
-
 Namibia
-
 Nepal
Nepal
-
 Netherlands
-
 New Zealand
-
 Nigeria
-
 North Macedonia
-
 Norway
-
 Oman
Oman
-
 Pakistan
-
 Palestine
-
 Panama
-
 Papua New Guinea
-
 Paraguay
-
 Peru
Peru
-
 Philippines
-
 Poland
-
 Portugal
-
 Puerto Rico
-
 Qatar
Qatar
-
 Reunion
-
 Romania
-
 Rwanda
-
 Saudi Arabia
-
 Serbia
-
 Singapore
-
 Slovakia
-
 Slovenia
-
 Somalia
-
 South Africa
-
 Spain
Spain
-
 Sri Lanka
-
 Sweden
-
 Switzerland
-
 Syria
Syria
-
 Taiwan
-
 Tajikistan
-
 Tanzania
-
 Thailand
-
 Trinidad and Tobago
-
 Tunisia
-
 Turkey
-
 UAE
UAE
-
 Uganda
-
 Ukraine
-
 United Kingdom
-
United States
-
 Uruguay
-
 Uzbekistan
-
 Venezuela
-
 Vietnam
-
 Yemen
Yemen
-
 Zambia
-
 Zimbabwe
- Forex
- Crypto
