
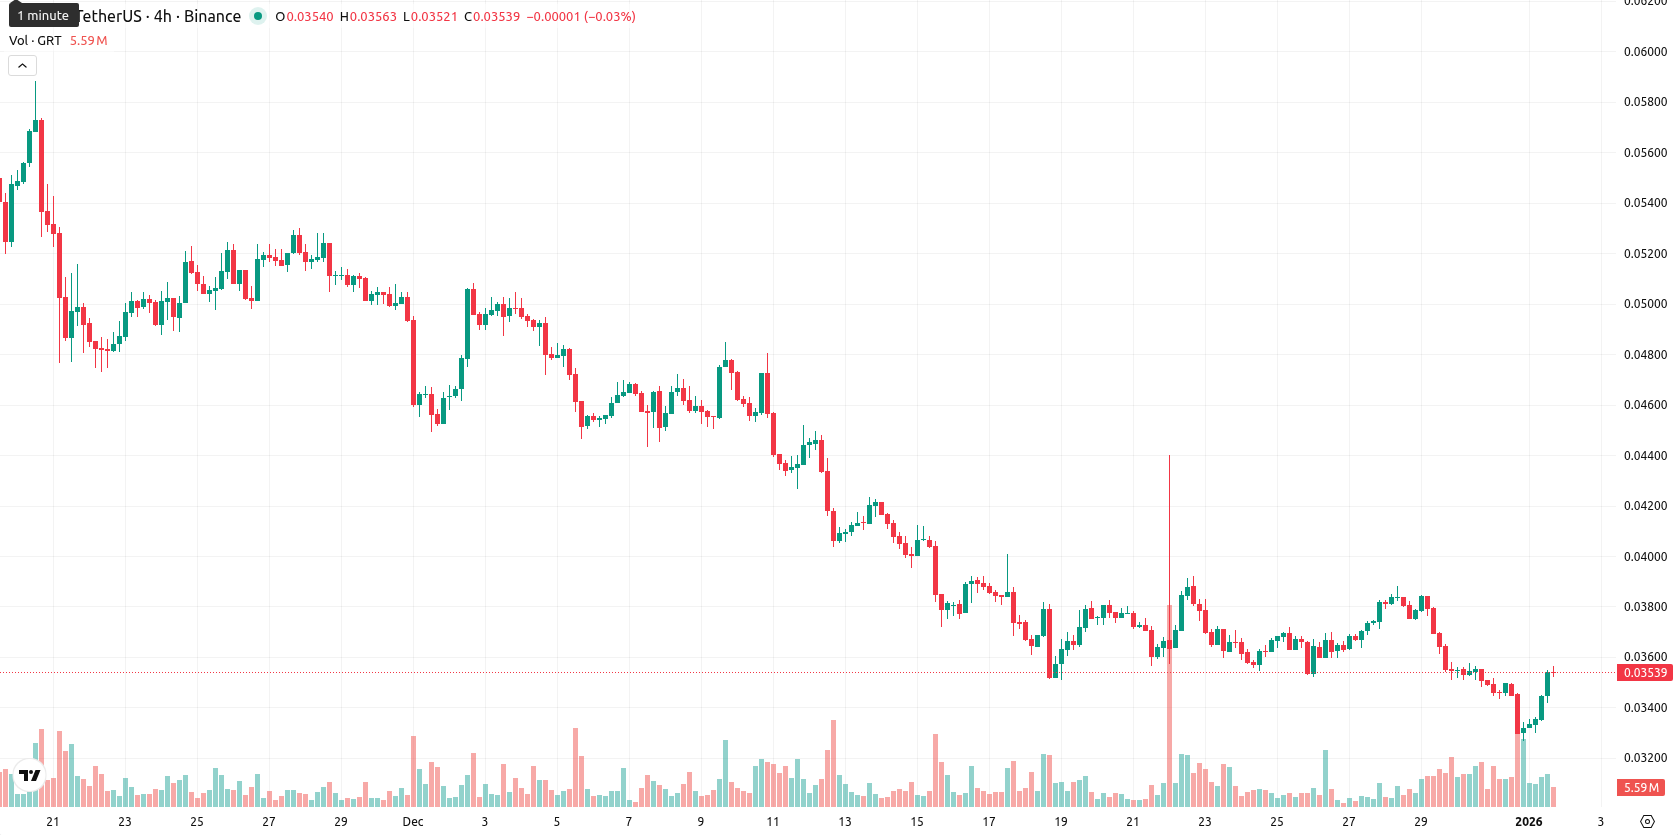
+7.22% for The Graph — sellers lose grip but volatility remains high

The Graph (GRT) is trading at $0.035435, below all key moving averages: MA-20 ($0.037382), MA-50 ($0.045576), and MA-200 ($0.075495), pointing to ongoing seller dominance across short, medium, and long-term trends. The nearest dynamic resistance is the Kijun level from Ichimoku at $0.040575, while there is no effective moving average support nearby at the current price.
Highlights
- The Graph (GRT) trades at $0.035435, down from key technical levels including MA-20 ($0.037382), MA-50 ($0.045576), and MA-200 ($0.075495), indicating persistent bearish trends.
- Despite a daily gain of 7.22% to $0.035435 and high volatility, momentum indicators such as MACD, ADX, RSI (31.24), and CCI (−164.69) all confirm continued seller dominance.
- GRT is expected to consolidate between $0.032 and $0.038 over the next five days, with less than 20% probability of a significant price increase.
Mixed intraday rebound as daily momentum and oscillators diverge
Daily momentum signals remain weak, with MACD and ADX both in “sell” territory, reflecting bearish pressure. RSI (31.24) and CCI (−164.69) indicate the market is oversold, while Stoch RSI registers a neutral reading on D1 but shows mixed overbought/oversold signals intraday. The BBP value is negative with a sell rating, confirming seller dominance in the current session. The daily performance shows a firm 7.22% gain to $0.035435, with no gap between yesterday’s close and today’s open, and price now sitting near the upper end of the session’s range — signaling high volatility and strength toward the daily highs. Despite this, the oscillators and momentum signals are divergent: the underlying trend is weak, but intraday activity shows buyers attempting a rebound.
Downside risk prevails as price range narrows near support
For the next five trading days, the expected price range is approximately $0.032 to $0.038, reflecting a typical volatility band relative to current levels. The probability of a further price increase is very low (less than 20%), making a decline more likely. In the baseline scenario, GRT may consolidate sideways within this corridor. A bullish scenario would require a decisive push above the $0.0406 resistance, potentially targeting $0.038 and beyond, while a bearish scenario could unfold if price breaks below the $0.032 support area, exposing the asset to additional downside pressure.
Previously it was reported that The Graph (GRT) continues to trade below its key moving averages, with strong downside momentum confirmed by the MACD, ADX, and multiple oscillators including a low RSI, while the nearest dynamic resistance remains at $0.0427 and meaningful moving average support is lacking. The technical outlook suggests high downside risk and persistent bearish pressure, with volatility anchoring the asset within a $0.0315–$0.0370 range barring a decisive move above current resistance levels.


-
 Afghanistan
-
 Albania
-
 Algeria
-
 Angola
-
 Argentina
-
 Armenia
-
 Australia
-
 Austria
-
 Azerbaijan
-
 Bahamas
-
 Bahrain
-
 Bangladesh
-
 Belarus
-
 Belgium
-
 Bolivia
-
 Botswana
-
 Brazil
-
 Brunei
-
 Bulgaria
-
 Cambodia
-
 Cameroon
-
 Canada
-
 Chile
Chile
-
 China
China
-
 Colombia
-
 Congo
Congo
-
 Costa Rica
-
 Cote d'Ivoire
-
 Croatia
-
 Cuba
Cuba
-
 Cyprus
-
 Czechia
-
 DR Congo
-
 Denmark
-
 Dominican Republic
-
 Ecuador
-
 Egypt
Egypt
-
 El Salvador
-
 Estonia
-
 Eswatini
-
 Ethiopia
-
 Finland
-
 France
-
 Georgia
-
 Germany
-
 Ghana
Ghana
-
 Greece
-
 Haiti
Haiti
-
 Hong Kong
-
 Hungary
-
 India
India
-
 Indonesia
-
 Iran, Islamic republic
-
 Iraq
Iraq
-
 Ireland
-
 Israel
-
 Italy
Italy
-
 Jamaica
-
 Japan
Japan
-
 Jordan
-
 Kazakhstan
-
 Kenya
Kenya
-
 Korea
Korea
-
 Kuwait
-
 Kyrgyzstan
-
 Laos
Laos
-
 Latvia
-
 Lebanon
-
 Lesotho
-
 Libya
Libya
-
 Lithuania
-
 Luxembourg
-
 Madagascar
-
 Malaysia
-
 Malta
Malta
-
 Mauritius
-
 Mexico
-
 Moldova
-
 Mongolia
-
 Montenegro
-
 Morocco
-
 Mozambique
-
 Myanmar
-
 Namibia
-
 Nepal
Nepal
-
 Netherlands
-
 New Zealand
-
 Nigeria
-
 North Macedonia
-
 Norway
-
 Oman
Oman
-
 Pakistan
-
 Palestine
-
 Panama
-
 Papua New Guinea
-
 Paraguay
-
 Peru
Peru
-
 Philippines
-
 Poland
-
 Portugal
-
 Puerto Rico
-
 Qatar
Qatar
-
 Reunion
-
 Romania
-
 Rwanda
-
 Saudi Arabia
-
 Serbia
-
 Singapore
-
 Slovakia
-
 Slovenia
-
 Somalia
-
 South Africa
-
 Spain
Spain
-
 Sri Lanka
-
 Sweden
-
 Switzerland
-
 Syria
Syria
-
 Taiwan
-
 Tajikistan
-
 Tanzania
-
 Thailand
-
 Trinidad and Tobago
-
 Tunisia
-
 Turkey
-
 UAE
UAE
-
 Uganda
-
 Ukraine
-
 United Kingdom
-
United States
-
 Uruguay
-
 Uzbekistan
-
 Venezuela
-
 Vietnam
-
 Yemen
Yemen
-
 Zambia
-
 Zimbabwe
- Forex
- Crypto
