
-1.30% for Polkadot — intraday volatility rises amid seller pressure

Polkadot (DOT) is trading at $2.126, just above both its MA-20 ($1.863) and MA-50 ($2.111), but well below the long-term MA-200 ($3.296). This confirms a short-term bullish structure with ongoing medium-term recovery, while the long-term trend remains under pressure from sellers; the nearest dynamic support is the Ichimoku Kijun at $1.985, with resistance at the MA-50 around $2.111.
DOT price prediction
Current price:
$ 0.857
-0.027
3.05%
Real-time Data
16:23
Daily range
0.819
 0.899
0.899
Weekly range
0.842
0.982
Loading...
Highlights
- Polkadot has advanced technical innovations focused on cross-chain communication via its parachain model since launching in 2020.
- Recent sessions saw growth in Polkadot's trading volumes and market capitalization, indicating increased market activity for the asset.
- Despite these gains, reports cite continued pressure for further support across the broader crypto market, suggesting underlying caution among investors.
Ecosystem advances and higher trading volumes as support expectations rise
Polkadot continues to advance technical innovations within its ecosystem, maintaining a focus on cross-chain communication through its parachain model since its 2020 launch. Trading volumes and market capitalization have experienced growth in recent sessions. Some reports note ongoing pressure for further support within the broader crypto market.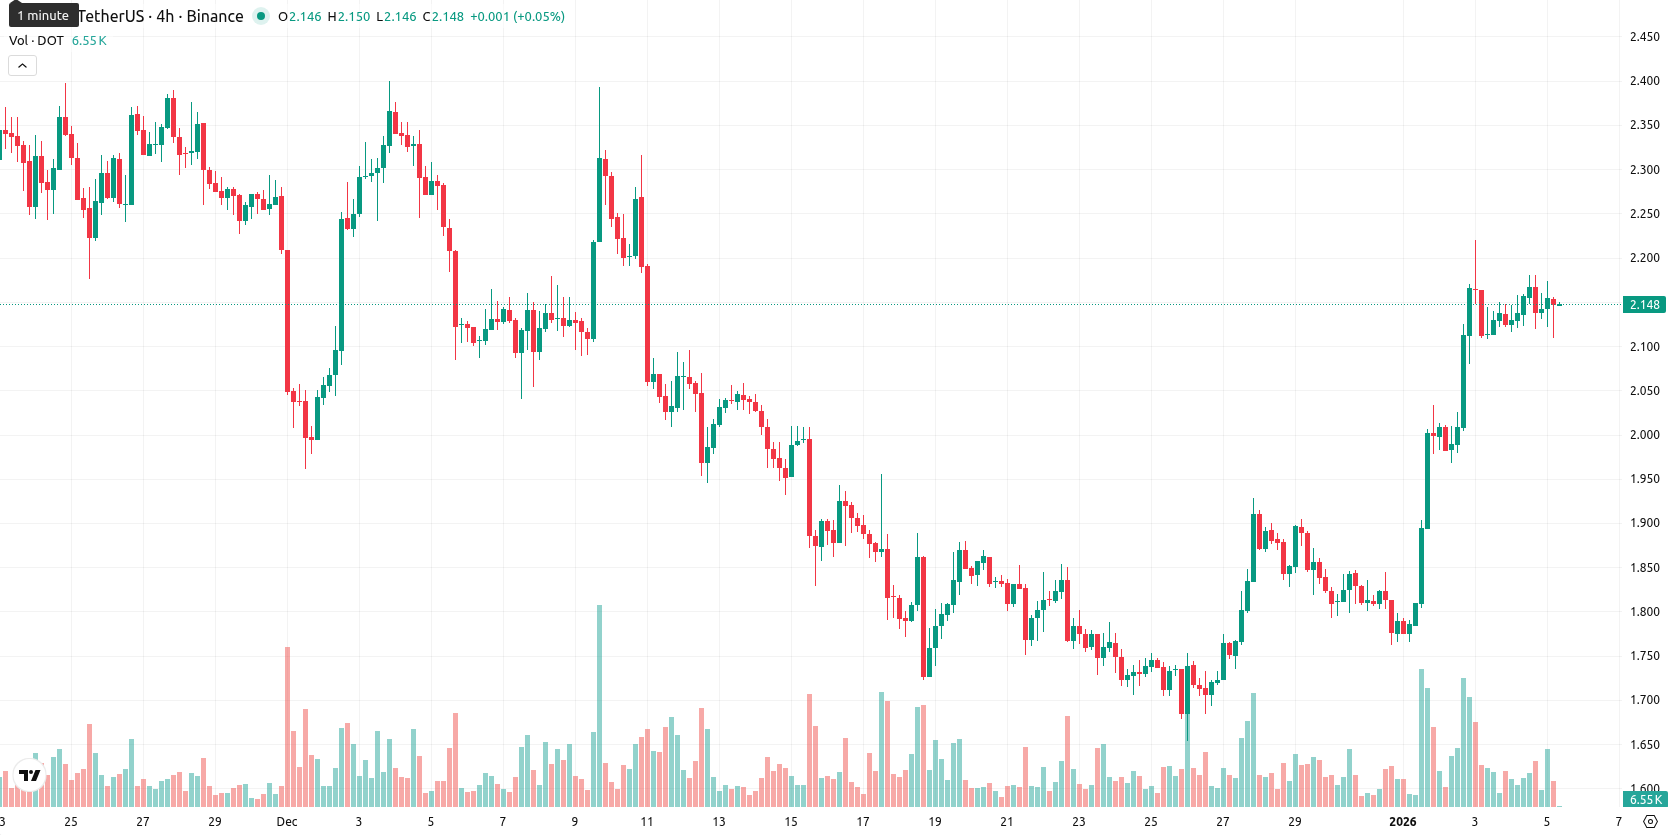
Mixed oscillator signals as buyer pressure diverges from overbought reads
Momentum indicators send mixed messages: while the daily ADX suggests trend strength, MACD is neutral, and the RSI at 58.79 leans bullish, but Stoch RSI and CCI are overbought. BBP signals buyer dominance, and the Awesome Oscillator supports bullish momentum, but daily price is slipping 1.30% after a gapless open, now sitting near today’s low of $2.12 in a moderate volatility session. Intraday tone is cautious, with renewed pressure after the open; this divergence between overbought oscillators and persistent buyer pressure hints at a risk of short-term pullback despite underlying strength.Downside risk for DOT as weekly technicals favor continued consolidation
Looking ahead, DOT’s expected trading range for the next week is $2.10 to $2.13, tightly aligned with the current level to reflect typical volatility and volatility band relative to current levels. Based on weekly indicators (all bearish), there is a very low probability (less than 20%) of a price increase, making a further decline more likely. Baseline scenario: DOT consolidates sideways between dynamic support ($1.99) and resistance ($2.13). Bullish case: a sustained move above $2.13 could trigger a test of higher levels. Bearish case: a drop below $2.10 may invite renewed selling toward the $2.00 area.
Viktoras Karapetjanc, analyst at Traders Union, sees Polkadot showing resilient short-term momentum and ongoing recovery signs above key moving averages. He notes that ecosystem advancements and greater volume reflect positive sentiment, but long-term weakness and overbought technicals suggest short-term caution. Karapetjanc believes that while bullish momentum persists, the odds still favor consolidation or even renewed selling if support fails. He remains optimistic about Polkadot’s innovative potential and market positioning. "Polkadot’s current strength is promising, but patience will reward those waiting for a clear breakout above $2.13 or fresh support from the broader crypto market."
Previously it was reported that Polkadot is exhibiting short- and medium-term bullish momentum, trading above both its 20- and 50-day moving averages while remaining pressured by its long-term 200-day moving average. Momentum indicators are mixed, with overbought oscillators and bullish intraday signals offset by a strong sell MACD and ongoing consolidation within a defined support and resistance range, pointing to limited near-term breakout potential.
Source of Data:
DOT Price Analysis by TU
The analysis is based on a proprietary model combining technical, on-chain, and expert data. Not investment advice. See
methodology
The information is based on forecasts and does not constitute investment advice or a guarantee of future results. Market conditions may change. See our Disclaimer and Editorial Integrity for details.
Subscribe to TU news

Did you like the article?


Latest Polkadot News


Weekly Top Bonuses

Top News


Top 5 companies for you

United States
-
 Afghanistan
-
 Albania
-
 Algeria
-
 Angola
-
 Argentina
-
 Armenia
-
 Australia
-
 Austria
-
 Azerbaijan
-
 Bahamas
-
 Bahrain
-
 Bangladesh
-
 Belarus
-
 Belgium
-
 Bolivia
-
 Botswana
-
 Brazil
-
 Brunei
-
 Bulgaria
-
 Cambodia
-
 Cameroon
-
 Canada
-
 Chile
Chile
-
 China
China
-
 Colombia
-
 Congo
Congo
-
 Costa Rica
-
 Cote d'Ivoire
-
 Croatia
-
 Cuba
Cuba
-
 Cyprus
-
 Czechia
-
 DR Congo
-
 Denmark
-
 Dominican Republic
-
 Ecuador
-
 Egypt
Egypt
-
 El Salvador
-
 Estonia
-
 Eswatini
-
 Ethiopia
-
 Finland
-
 France
-
 Georgia
-
 Germany
-
 Ghana
Ghana
-
 Greece
-
 Haiti
Haiti
-
 Hong Kong
-
 Hungary
-
 India
India
-
 Indonesia
-
 Iran, Islamic republic
-
 Iraq
Iraq
-
 Ireland
-
 Israel
-
 Italy
Italy
-
 Jamaica
-
 Japan
Japan
-
 Jordan
-
 Kazakhstan
-
 Kenya
Kenya
-
 Korea
Korea
-
 Kuwait
-
 Kyrgyzstan
-
 Laos
Laos
-
 Latvia
-
 Lebanon
-
 Lesotho
-
 Libya
Libya
-
 Lithuania
-
 Luxembourg
-
 Madagascar
-
 Malaysia
-
 Malta
Malta
-
 Mauritius
-
 Mexico
-
 Moldova
-
 Mongolia
-
 Montenegro
-
 Morocco
-
 Mozambique
-
 Myanmar
-
 Namibia
-
 Nepal
Nepal
-
 Netherlands
-
 New Zealand
-
 Nigeria
-
 North Macedonia
-
 Norway
-
 Oman
Oman
-
 Pakistan
-
 Palestine
-
 Panama
-
 Papua New Guinea
-
 Paraguay
-
 Peru
Peru
-
 Philippines
-
 Poland
-
 Portugal
-
 Puerto Rico
-
 Qatar
Qatar
-
 Reunion
-
 Romania
-
 Rwanda
-
 Saudi Arabia
-
 Serbia
-
 Singapore
-
 Slovakia
-
 Slovenia
-
 Somalia
-
 South Africa
-
 Spain
Spain
-
 Sri Lanka
-
 Sweden
-
 Switzerland
-
 Syria
Syria
-
 Taiwan
-
 Tajikistan
-
 Tanzania
-
 Thailand
-
 Trinidad and Tobago
-
 Tunisia
-
 Turkey
-
 UAE
UAE
-
 Uganda
-
 Ukraine
-
 United Kingdom
-
United States
-
 Uruguay
-
 Uzbekistan
-
 Venezuela
-
 Vietnam
-
 Yemen
Yemen
-
 Zambia
-
 Zimbabwe
- Forex
- Crypto
Live News
