
Official Trump price prediction: Сan $TRUMP hold above support amid mixed signals?

Official Trump (TRUMP) is trading at $5.48, above its MA-20 ($5.03) but below MA-50 ($5.66) and well below MA-200 ($7.68), signaling a short-term bullish bias but ongoing medium- and long-term pressure from sellers.
TRUMP price prediction
Current price:
$ 1.69
-0.08
4.64%
Real-time Data
20:50
Daily range
1.62
 1.78
1.78
Weekly range
1.72
2.02
Loading...
Highlights
- TRUMP closed at $5.48, above its MA-20 ($5.03) but below MA-50 ($5.66) and MA-200 ($7.68), reflecting a short-term bullish bias within longer-term bearish trends.
- The expected 5-day price range is $5.29 to $5.44, with less than 20% probability of a rise, as key weekly momentum indicators remain bearish or neutral.
- Oscillators signal overbought conditions and possible exhaustion, as price approached the session high and volatility stayed moderate with no gap at the open.
Split technical signals as oscillators diverge near key levels
The immediate dynamic support is near the Ichimoku Kijun level at $5.33, while resistance emerges at the MA-50 around $5.66. Momentum readings are split: D1 MACD shows strong bearish momentum alongside a bearish ADX, while the RSI at 56 signals mild buyer interest. However, daily Stoch RSI and CCI remain overbought, and BBP points to intraday buyer dominance. The Awesome Oscillator is neutral, and there’s notable divergence among oscillators, suggesting a mixed setup.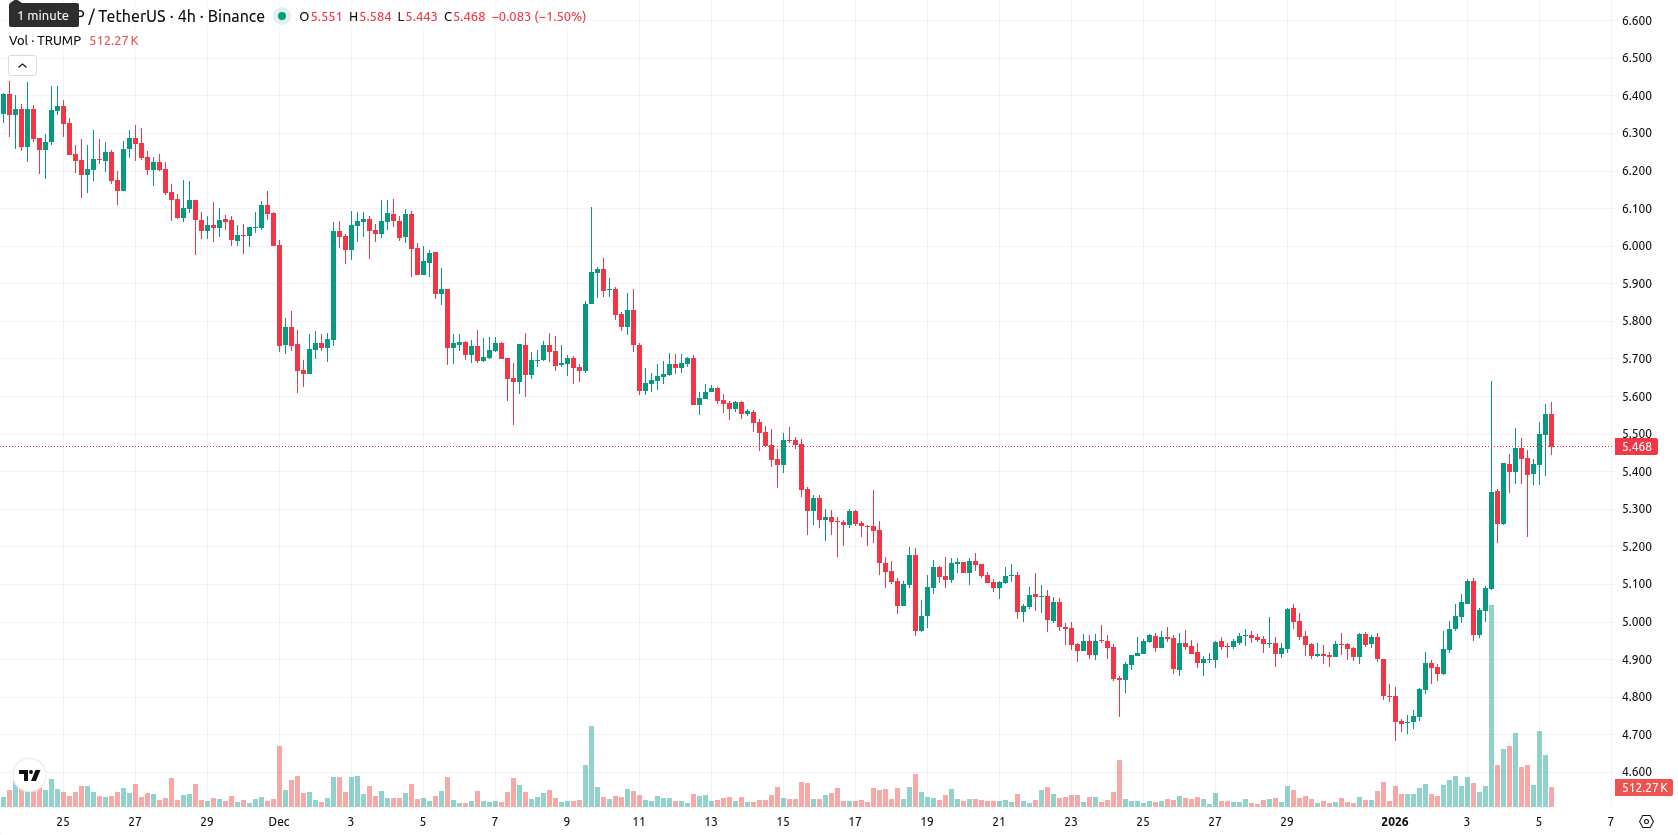
Downside risk prevails amid bearish bias and limited breakout odds
For the next 5 trading days, the expected price range is $5.29 to $5.44, consistent with typical volatility bands. The probability of a rise is very low (less than 20%), making a decline more likely, as all major weekly momentum and trend indicators remain bearish or neutral. If the price holds steady, it will likely remain confined between $5.29 support and $5.44 resistance. A bullish breakout above $5.44 could trigger a push toward the MA-50, while a bearish break below $5.29 may expose further downside risk, especially if overbought conditions unwind.
Viktoras Karapetjanc, Traders Union expert, sees Official Trump (TRUMP) trading in a mixed but slightly constructive setup. He notes price is above the MA-20, but longer-term moving averages and oscillators still show underlying weakness. Macro and sentiment signals remain neutral to bearish, but short-term inflows offer limited hope. Karapetjanc believes buyers need to clear $5.44 for any real upside traction. "If TRUMP stays above $5.29, a breakout above $5.44 could quickly shift momentum in the bulls’ favor."
Previously it was reported that Official Trump is trading above its short-term moving average, but remains below key medium- and long-term trends, with technical indicators highlighting short-term bullishness amid underlying seller pressure. Despite strong overbought signals and mixed momentum readings, resistance near the MA-50 and risks of reversal suggest a sideways to bearish outlook in the near term, barring a breakout above current resistance levels.
Source of Data:
TRUMP Price Analysis by TU
The analysis is based on a proprietary model combining technical, on-chain, and expert data. Not investment advice. See
methodology
The information is based on forecasts and does not constitute investment advice or a guarantee of future results. Market conditions may change. See our Disclaimer and Editorial Integrity for details.
Subscribe to TU news

Did you like the article?


Weekly Top Bonuses

Top News


Top 5 companies for you

United States
-
 Afghanistan
-
 Albania
-
 Algeria
-
 Angola
-
 Argentina
-
 Armenia
-
 Australia
-
 Austria
-
 Azerbaijan
-
 Bahamas
-
 Bahrain
-
 Bangladesh
-
 Belarus
-
 Belgium
-
 Bolivia
-
 Botswana
-
 Brazil
-
 Brunei
-
 Bulgaria
-
 Cambodia
-
 Cameroon
-
 Canada
-
 Chile
Chile
-
 China
China
-
 Colombia
-
 Congo
Congo
-
 Costa Rica
-
 Cote d'Ivoire
-
 Croatia
-
 Cuba
Cuba
-
 Cyprus
-
 Czechia
-
 DR Congo
-
 Denmark
-
 Dominican Republic
-
 Ecuador
-
 Egypt
Egypt
-
 El Salvador
-
 Estonia
-
 Eswatini
-
 Ethiopia
-
 Finland
-
 France
-
 Georgia
-
 Germany
-
 Ghana
Ghana
-
 Greece
-
 Haiti
Haiti
-
 Hong Kong
-
 Hungary
-
 India
India
-
 Indonesia
-
 Iran, Islamic republic
-
 Iraq
Iraq
-
 Ireland
-
 Israel
-
 Italy
Italy
-
 Jamaica
-
 Japan
Japan
-
 Jordan
-
 Kazakhstan
-
 Kenya
Kenya
-
 Korea
Korea
-
 Kuwait
-
 Kyrgyzstan
-
 Laos
Laos
-
 Latvia
-
 Lebanon
-
 Lesotho
-
 Libya
Libya
-
 Lithuania
-
 Luxembourg
-
 Madagascar
-
 Malaysia
-
 Malta
Malta
-
 Mauritius
-
 Mexico
-
 Moldova
-
 Mongolia
-
 Montenegro
-
 Morocco
-
 Mozambique
-
 Myanmar
-
 Namibia
-
 Nepal
Nepal
-
 Netherlands
-
 New Zealand
-
 Nigeria
-
 North Macedonia
-
 Norway
-
 Oman
Oman
-
 Pakistan
-
 Palestine
-
 Panama
-
 Papua New Guinea
-
 Paraguay
-
 Peru
Peru
-
 Philippines
-
 Poland
-
 Portugal
-
 Puerto Rico
-
 Qatar
Qatar
-
 Reunion
-
 Romania
-
 Rwanda
-
 Saudi Arabia
-
 Serbia
-
 Singapore
-
 Slovakia
-
 Slovenia
-
 Somalia
-
 South Africa
-
 Spain
Spain
-
 Sri Lanka
-
 Sweden
-
 Switzerland
-
 Syria
Syria
-
 Taiwan
-
 Tajikistan
-
 Tanzania
-
 Thailand
-
 Trinidad and Tobago
-
 Tunisia
-
 Turkey
-
 UAE
UAE
-
 Uganda
-
 Ukraine
-
 United Kingdom
-
United States
-
 Uruguay
-
 Uzbekistan
-
 Venezuela
-
 Vietnam
-
 Yemen
Yemen
-
 Zambia
-
 Zimbabwe
- Forex
- Crypto
Live News
