
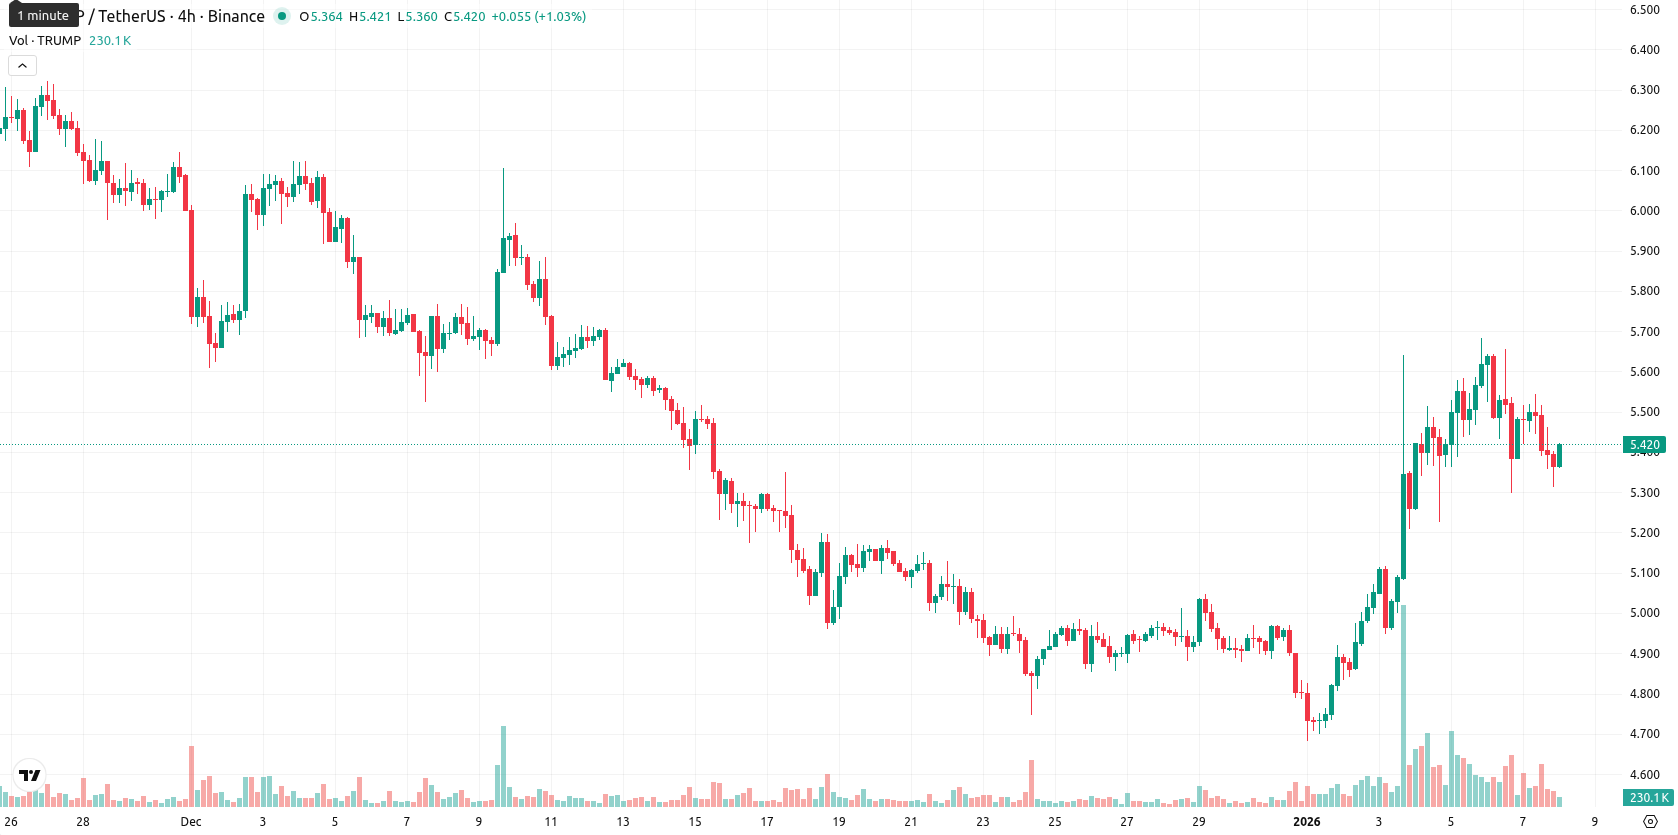
TRUMP: Weak bullish momentum meets resistance as price consolidates

Official Trump (TRUMP) is currently trading at $5.41, standing above the MA-20 ($5.08) but just below the MA-50 ($5.57), with the longer-term MA-200 ($7.63) well above the market. This structure points to short-term bullish momentum, but medium- and long-term trends remain under pressure from sellers; the closest dynamic support is near the Ichimoku Kijun at $5.18, while resistance is expected at the MA-50 ($5.57).
Highlights
- TRUMP trades at $5.41, just above the MA-20 ($5.08) and below the MA-50 ($5.57), indicating short-term bullish momentum but ongoing medium- and long-term seller pressure.
- Mixed momentum signals persist as ADX (25.96) is supportive of buying, but MACD shows a strong sell bias and daily RSI is neutral to bullish at 52.50.
- Expected five-day trading range is $5.20–$5.60, with probability of a price increase under 20%, suggesting consolidation or downside risk below $5.18.
Mixed momentum and buyer dominance as technical signals diverge
Momentum signals are mixed: while the ADX on D1 is supportive of buying activity (25.96), the MACD signals a strong sell bias and the daily RSI is neutral to bullish at 52.50. Overbought conditions are indicated by the Commodity Channel Index, though the Stochastic RSI reads neutral. Bull/Bear Power is positive at 0.31, signaling buyer dominance intraday. The Awesome Oscillator direction is neutral and does not confirm the daily trend. The session shows a narrow 5.35 – 5.41 range, with the current price near the session high, no gap at the open, and low intraday volatility; overall, the tone is slightly positive but momentum and oscillators show a clear divergence. This leaves price action somewhat conflicted, as buyer pressure is not fully confirmed by underlying momentum signals.
Bearish bias dominates as probability of upside remains low
For the next five trading days, the expected price range is $5.20 to $5.60, keeping movements within a typical volatility band relative to current levels. The probability of a price increase is very low (less than 20%), making a decline the more likely scenario, based on the strong bearish consensus across MACD, ADX, and RSI on the weekly timeframe. In the baseline scenario, price consolidates between support ($5.18) and resistance ($5.57). A bullish case would require a break above $5.57, targeting higher levels, while a bearish scenario sees a move below $5.18, opening the door for further downside.
Previously it was reported that Official Trump is trading above its 20-day moving average but remains capped by medium- and long-term resistance, with mixed momentum indicators highlighting both short-term bullishness and lingering downside risk. Key technicals suggest rangebound consolidation is likely near support at $5.20 and resistance at $5.60, as overall signals skew modestly bearish for the coming week.


-
 Afghanistan
-
 Albania
-
 Algeria
-
 Angola
-
 Argentina
-
 Armenia
-
 Australia
-
 Austria
-
 Azerbaijan
-
 Bahamas
-
 Bahrain
-
 Bangladesh
-
 Belarus
-
 Belgium
-
 Bolivia
-
 Botswana
-
 Brazil
-
 Brunei
-
 Bulgaria
-
 Cambodia
-
 Cameroon
-
 Canada
-
 Chile
Chile
-
 China
China
-
 Colombia
-
 Congo
Congo
-
 Costa Rica
-
 Cote d'Ivoire
-
 Croatia
-
 Cuba
Cuba
-
 Cyprus
-
 Czechia
-
 DR Congo
-
 Denmark
-
 Dominican Republic
-
 Ecuador
-
 Egypt
Egypt
-
 El Salvador
-
 Estonia
-
 Eswatini
-
 Ethiopia
-
 Finland
-
 France
-
 Georgia
-
 Germany
-
 Ghana
Ghana
-
 Greece
-
 Haiti
Haiti
-
 Hong Kong
-
 Hungary
-
 India
India
-
 Indonesia
-
 Iran, Islamic republic
-
 Iraq
Iraq
-
 Ireland
-
 Israel
-
 Italy
Italy
-
 Jamaica
-
 Japan
Japan
-
 Jordan
-
 Kazakhstan
-
 Kenya
Kenya
-
 Korea
Korea
-
 Kuwait
-
 Kyrgyzstan
-
 Laos
Laos
-
 Latvia
-
 Lebanon
-
 Lesotho
-
 Libya
Libya
-
 Lithuania
-
 Luxembourg
-
 Madagascar
-
 Malaysia
-
 Malta
Malta
-
 Mauritius
-
 Mexico
-
 Moldova
-
 Mongolia
-
 Montenegro
-
 Morocco
-
 Mozambique
-
 Myanmar
-
 Namibia
-
 Nepal
Nepal
-
 Netherlands
-
 New Zealand
-
 Nigeria
-
 North Macedonia
-
 Norway
-
 Oman
Oman
-
 Pakistan
-
 Palestine
-
 Panama
-
 Papua New Guinea
-
 Paraguay
-
 Peru
Peru
-
 Philippines
-
 Poland
-
 Portugal
-
 Puerto Rico
-
 Qatar
Qatar
-
 Reunion
-
 Romania
-
 Rwanda
-
 Saudi Arabia
-
 Serbia
-
 Singapore
-
 Slovakia
-
 Slovenia
-
 Somalia
-
 South Africa
-
 Spain
Spain
-
 Sri Lanka
-
 Sweden
-
 Switzerland
-
 Syria
Syria
-
 Taiwan
-
 Tajikistan
-
 Tanzania
-
 Thailand
-
 Trinidad and Tobago
-
 Tunisia
-
 Turkey
-
 UAE
UAE
-
 Uganda
-
 Ukraine
-
 United Kingdom
-
United States
-
 Uruguay
-
 Uzbekistan
-
 Venezuela
-
 Vietnam
-
 Yemen
Yemen
-
 Zambia
-
 Zimbabwe
- Forex
- Crypto
