
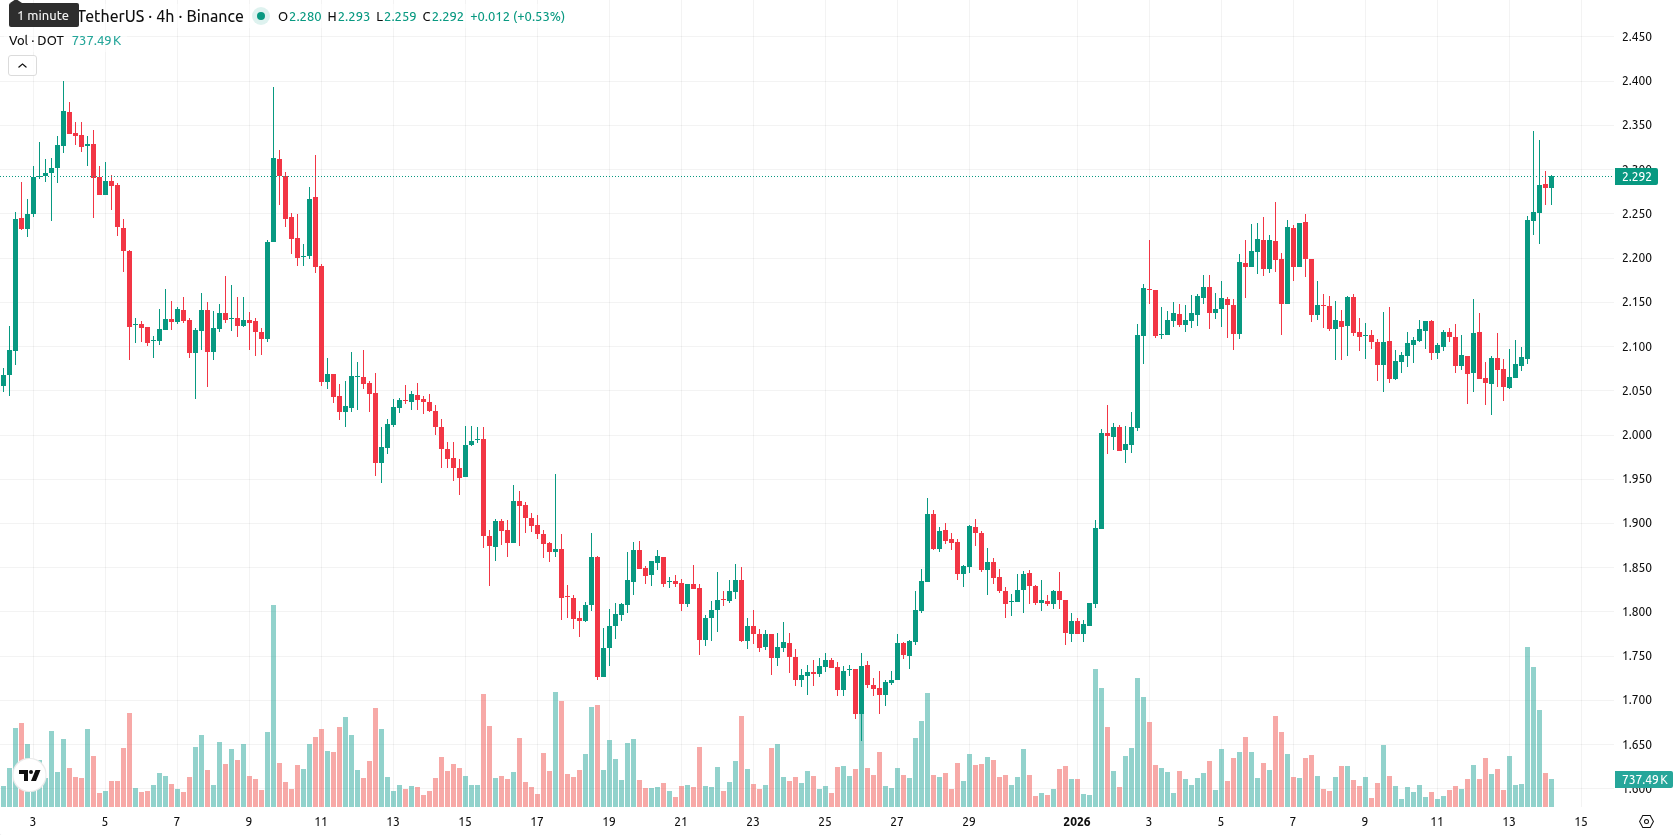
+8.87% for Polkadot — volatility spikes despite weekly bearish trends

Polkadot (DOT) is currently trading at $2.284, sitting above its MA-20 ($2.016) and MA-50 ($2.043), but well below the MA-200 ($3.240). This positioning signals that short- and medium-term trends remain constructive, while long-term pressure from sellers persists, with the nearest support at the D1 Ichimoku Kijun ($1.998) and dynamic resistance anticipated near the MA-50 or the next round level above.
Highlights
- Polkadot (DOT) trades at $2.284, above its MA-20 ($2.016) and MA-50 ($2.043) but remains well below the MA-200 ($3.240), indicating persistent long-term selling pressure.
- Daily momentum indicators, including MACD, ADX, and an RSI of 63.2, point to strong buyer dominance, while Stochastic RSI and CCI signal overbought conditions and possible short-term exhaustion.
- Despite an 8.87% daily gain and trading near session highs, DOT faces a likely sideways consolidation in the $2.06–$2.40 range, with a bearish bias reflected by weekly trend signals.
Buyers lead as momentum flags early exhaustion signs
Momentum indicators on the daily timeframe suggest a clear tilt in favor of buyers. Both the MACD and ADX show bullish momentum, confirmed by strong "Buy" readings, while the RSI at 63.2 and the Bull/Bear Power value at 0.248 point to healthy buyer dominance. Oscillators are more mixed: Stochastic RSI and CCI both flag overbought conditions, hinting at potential short-term exhaustion, but the Awesome Oscillator remains neutral. DOT gained 8.87% today, opening at $2.29 — signaling a minor opening gap up from the previous close — and is trading near the session’s high after a volatile, buyer-driven day.
Downward bias as weekly signals outweigh near-term stability
For the next five trading days, the expected range is $2.06–$2.40, which is adjusted for typical volatility and keeps the price within 10% bands of the current level. There is a very low probability (less than 20%) of further price increases, making a downward move more likely given overwhelmingly bearish signals on the weekly Moving Averages, RSI, ADX, and MACD. The baseline scenario is for DOT to consolidate sideways just above near-term support. A bullish scenario would require breaking above $2.40 with strong follow-through, while a bearish scenario could see prices retesting or slipping below the $2.06–$2.00 support zone.
Last time, analysts noted that Polkadot (DOT) is trading above its 20- and 50-day moving averages but remains well below the long-term 200-day average, indicating building short- to medium-term momentum amid ongoing bearish overhang. Momentum indicators such as MACD and RSI lean bullish, though divergence among oscillators and a soft ADX suggest any trend strength is currently weak, while high intraday volatility highlights upward pressure testing immediate resistance.


Latest Polkadot News


-
 Afghanistan
-
 Albania
-
 Algeria
-
 Angola
-
 Argentina
-
 Armenia
-
 Australia
-
 Austria
-
 Azerbaijan
-
 Bahamas
-
 Bahrain
-
 Bangladesh
-
 Belarus
-
 Belgium
-
 Bolivia
-
 Botswana
-
 Brazil
-
 Brunei
-
 Bulgaria
-
 Cambodia
-
 Cameroon
-
 Canada
-
 Chile
Chile
-
 China
China
-
 Colombia
-
 Congo
Congo
-
 Costa Rica
-
 Cote d'Ivoire
-
 Croatia
-
 Cuba
Cuba
-
 Cyprus
-
 Czechia
-
 DR Congo
-
 Denmark
-
 Dominican Republic
-
 Ecuador
-
 Egypt
Egypt
-
 El Salvador
-
 Estonia
-
 Eswatini
-
 Ethiopia
-
 Finland
-
 France
-
 Georgia
-
 Germany
-
 Ghana
Ghana
-
 Greece
-
 Haiti
Haiti
-
 Hong Kong
-
 Hungary
-
 India
India
-
 Indonesia
-
 Iran, Islamic republic
-
 Iraq
Iraq
-
 Ireland
-
 Israel
-
 Italy
Italy
-
 Jamaica
-
 Japan
Japan
-
 Jordan
-
 Kazakhstan
-
 Kenya
Kenya
-
 Korea
Korea
-
 Kuwait
-
 Kyrgyzstan
-
 Laos
Laos
-
 Latvia
-
 Lebanon
-
 Lesotho
-
 Libya
Libya
-
 Lithuania
-
 Luxembourg
-
 Madagascar
-
 Malaysia
-
 Malta
Malta
-
 Mauritius
-
 Mexico
-
 Moldova
-
 Mongolia
-
 Montenegro
-
 Morocco
-
 Mozambique
-
 Myanmar
-
 Namibia
-
 Nepal
Nepal
-
 Netherlands
-
 New Zealand
-
 Nigeria
-
 North Macedonia
-
 Norway
-
 Oman
Oman
-
 Pakistan
-
 Palestine
-
 Panama
-
 Papua New Guinea
-
 Paraguay
-
 Peru
Peru
-
 Philippines
-
 Poland
-
 Portugal
-
 Puerto Rico
-
 Qatar
Qatar
-
 Reunion
-
 Romania
-
 Rwanda
-
 Saudi Arabia
-
 Serbia
-
 Singapore
-
 Slovakia
-
 Slovenia
-
 Somalia
-
 South Africa
-
 Spain
Spain
-
 Sri Lanka
-
 Sweden
-
 Switzerland
-
 Syria
Syria
-
 Taiwan
-
 Tajikistan
-
 Tanzania
-
 Thailand
-
 Trinidad and Tobago
-
 Tunisia
-
 Turkey
-
 UAE
UAE
-
 Uganda
-
 Ukraine
-
 United Kingdom
-
United States
-
 Uruguay
-
 Uzbekistan
-
 Venezuela
-
 Vietnam
-
 Yemen
Yemen
-
 Zambia
-
 Zimbabwe
- Forex
- Crypto
