
Kava price prediction: deeper downside likely with weak trend signals? KAVA falls 7.42%

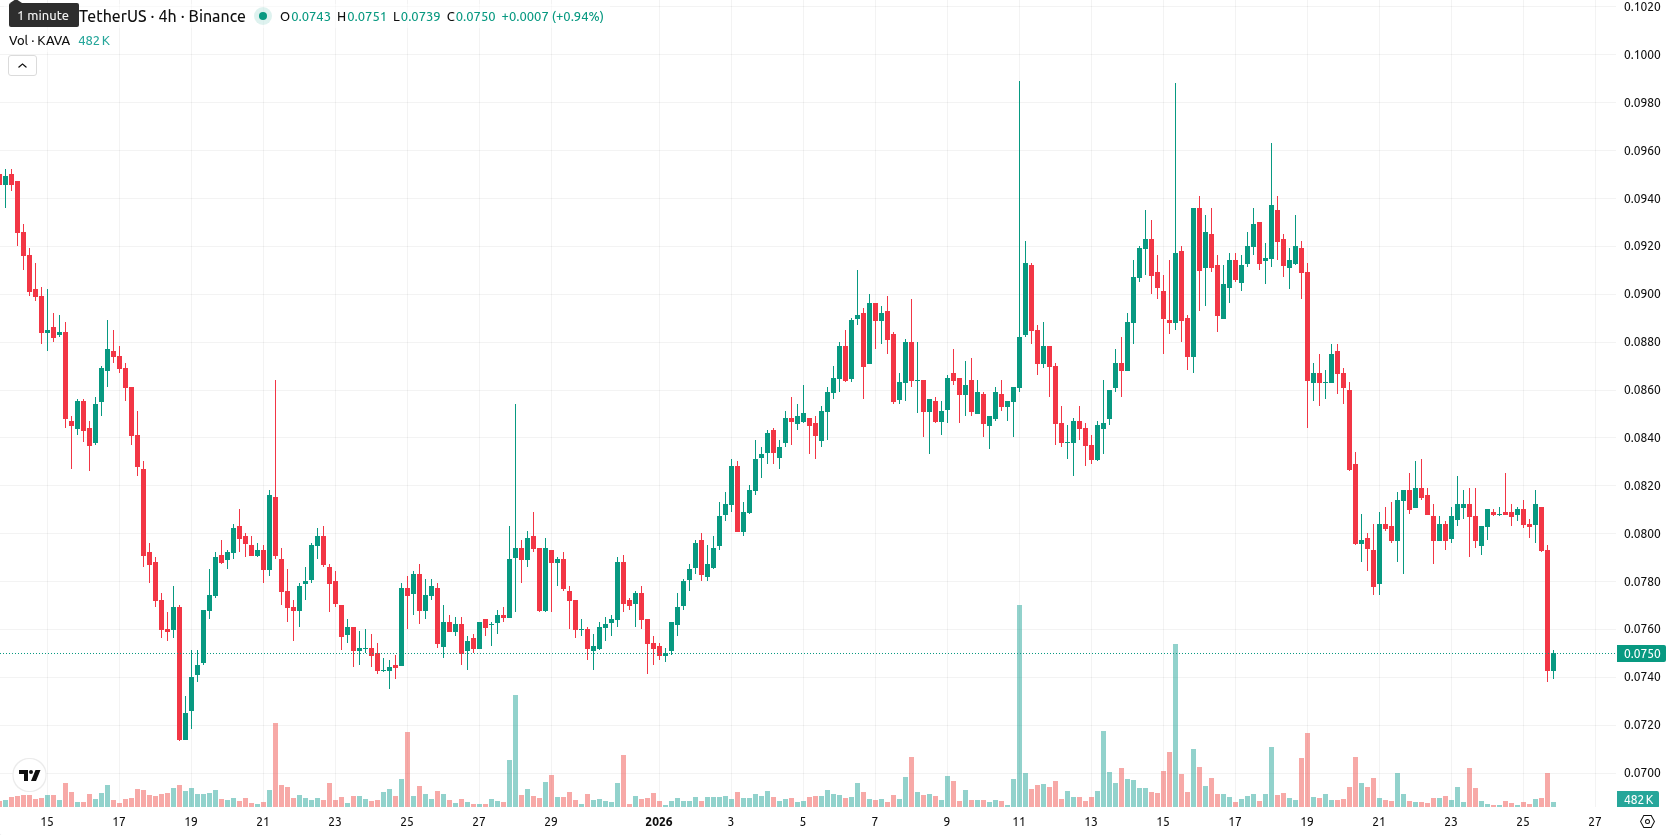
Kava (KAVA) is trading at $0.0749, which is well below the MA-20 at $0.0861, MA-50 at $0.0860, and MA-200 at $0.2344, highlighting persistent seller pressure across all time frames. The asset remains under its key moving averages, confirming a sustained bearish trend on both the short and long-term charts.
Highlights
- KAVA trades at $0.0749, significantly below its MA-20 ($0.0861), MA-50 ($0.0860), and MA-200 ($0.2344), reflecting persistent seller dominance.
- Momentum indicators including MACD and ADX are firmly negative, with RSI (42.9) and StochRSI (25) showing no clear oversold signal, and CCI (-104) suggesting mild oversold potential.
- The baseline scenario expects KAVA to remain in a $0.0700–$0.0780 consolidation range, with less than a 20% probability of a bullish reversal above $0.0780.
Weak reversal chances as indicators highlight seller dominance
Momentum signals for KAVA remain firmly negative, with the MACD and ADX both pointing to continuation of the downtrend and weak directional strength. The RSI at 42.9 and the Stochastic RSI near 25 indicate no clear oversold condition, while the CCI at -104 flags some oversold potential; Bull/Bear Power confirms sellers are dominating today’s action. The nearest dynamic resistance is the Ichimoku Kijun at $0.0865, and immediate support sits near the intraday low at $0.0738. Intraday volatility is elevated, as a sharp drop after the open pushed prices near session lows, signaling persistent, overwhelmingly bearish momentum with minimal reversal signals.
Downside risk prevails as volatility narrows trade range
Over the next five trading days, KAVA is likely to remain within a volatility band relative to current levels between $0.0700 and $0.0780. The probability of a price increase is low (less than 20%), making a further decline more likely in the short term. A baseline scenario anticipates continued sideways movement in this corridor, while a bullish breakout above $0.0780 — $0.0810 could open a path toward $0.0860. The more probable bearish scenario would see the price drop below $0.0700, increasing downside risk.
Previously it was reported that Kava is showing short-term bullish momentum above its 20-day moving average, but remains under medium- and long-term selling pressure as it trades below the 50- and 200-day averages, with immediate dynamic support at the Kijun line and resistance at the MA-50. Oscillator and momentum indicators are mixed—with some overbought signals—suggesting a limited upside and a baseline expectation for sideways movement within a defined range over the coming sessions.


-
 Afghanistan
-
 Albania
-
 Algeria
-
 Angola
-
 Argentina
-
 Armenia
-
 Australia
-
 Austria
-
 Azerbaijan
-
 Bahamas
-
 Bahrain
-
 Bangladesh
-
 Belarus
-
 Belgium
-
 Bolivia
-
 Botswana
-
 Brazil
-
 Brunei
-
 Bulgaria
-
 Cambodia
-
 Cameroon
-
 Canada
-
 Chile
Chile
-
 China
China
-
 Colombia
-
 Congo
Congo
-
 Costa Rica
-
 Cote d'Ivoire
-
 Croatia
-
 Cuba
Cuba
-
 Cyprus
-
 Czechia
-
 DR Congo
-
 Denmark
-
 Dominican Republic
-
 Ecuador
-
 Egypt
Egypt
-
 El Salvador
-
 Estonia
-
 Eswatini
-
 Ethiopia
-
 Finland
-
 France
-
 Georgia
-
 Germany
-
 Ghana
Ghana
-
 Greece
-
 Haiti
Haiti
-
 Hong Kong
-
 Hungary
-
 India
India
-
 Indonesia
-
 Iran, Islamic republic
-
 Iraq
Iraq
-
 Ireland
-
 Israel
-
 Italy
Italy
-
 Jamaica
-
 Japan
Japan
-
 Jordan
-
 Kazakhstan
-
 Kenya
Kenya
-
 Korea
Korea
-
 Kuwait
-
 Kyrgyzstan
-
 Laos
Laos
-
 Latvia
-
 Lebanon
-
 Lesotho
-
 Libya
Libya
-
 Lithuania
-
 Luxembourg
-
 Madagascar
-
 Malaysia
-
 Malta
Malta
-
 Mauritius
-
 Mexico
-
 Moldova
-
 Mongolia
-
 Montenegro
-
 Morocco
-
 Mozambique
-
 Myanmar
-
 Namibia
-
 Nepal
Nepal
-
 Netherlands
-
 New Zealand
-
 Nigeria
-
 North Macedonia
-
 Norway
-
 Oman
Oman
-
 Pakistan
-
 Palestine
-
 Panama
-
 Papua New Guinea
-
 Paraguay
-
 Peru
Peru
-
 Philippines
-
 Poland
-
 Portugal
-
 Puerto Rico
-
 Qatar
Qatar
-
 Reunion
-
 Romania
-
 Rwanda
-
 Saudi Arabia
-
 Serbia
-
 Singapore
-
 Slovakia
-
 Slovenia
-
 Somalia
-
 South Africa
-
 Spain
Spain
-
 Sri Lanka
-
 Sweden
-
 Switzerland
-
 Syria
Syria
-
 Taiwan
-
 Tajikistan
-
 Tanzania
-
 Thailand
-
 Trinidad and Tobago
-
 Tunisia
-
 Turkey
-
 UAE
UAE
-
 Uganda
-
 Ukraine
-
 United Kingdom
-
United States
-
 Uruguay
-
 Uzbekistan
-
 Venezuela
-
 Vietnam
-
 Yemen
Yemen
-
 Zambia
-
 Zimbabwe
- Forex
- Crypto
