
-8.33% for Movement — oversold conditions signal caution but sellers remain in control

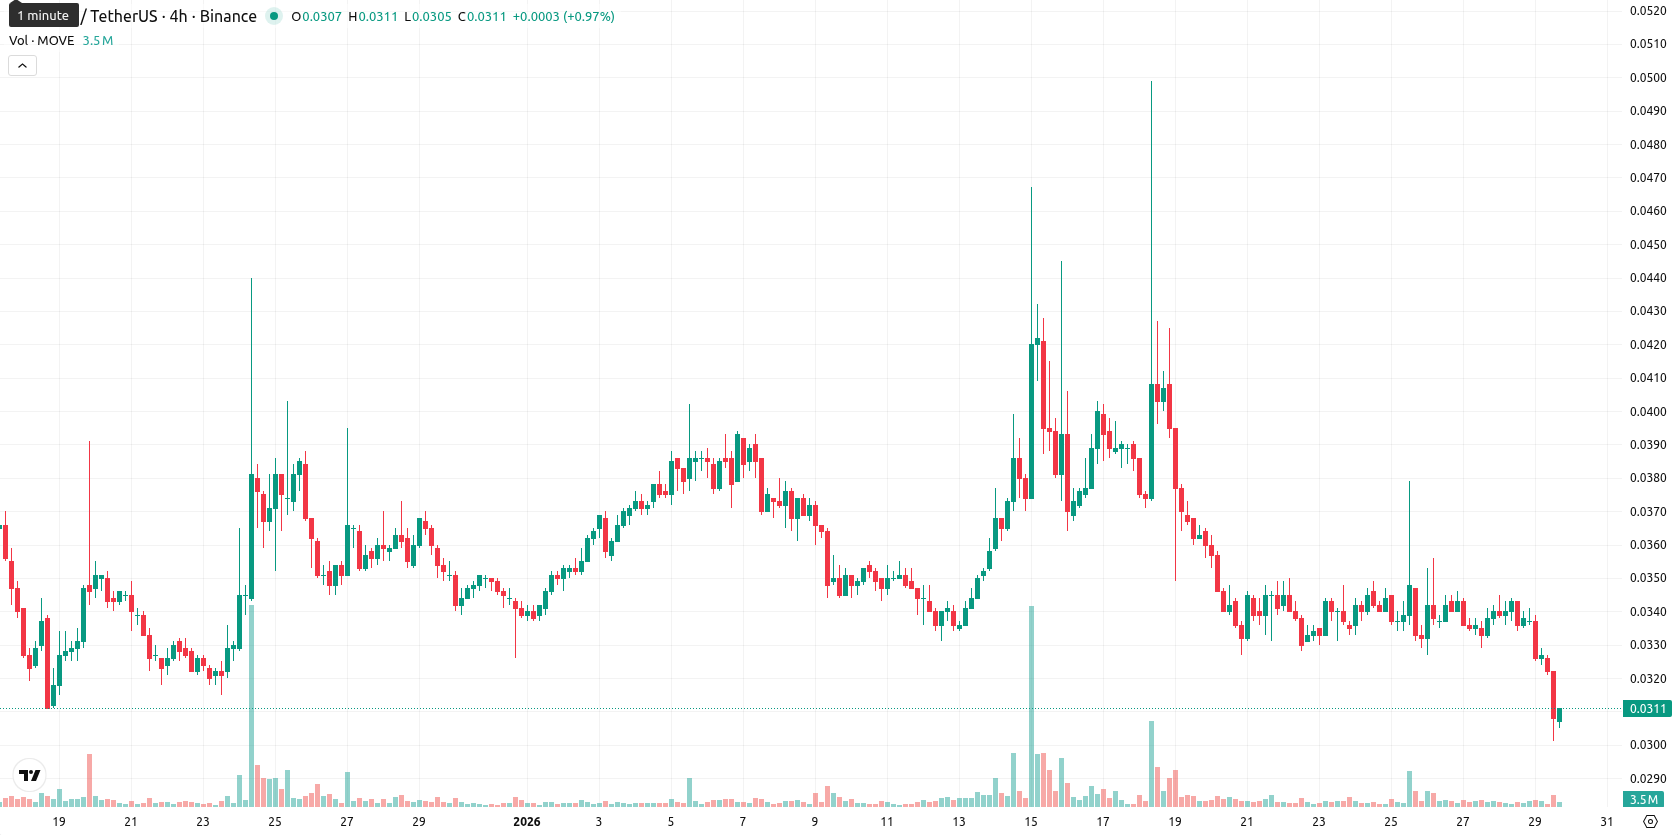
Movement (MOVE) is trading at $0.0308 after a daily loss of 8.33%. The asset sits well below the MA-20 ($0.0354), MA-50 ($0.0360), and MA-200 ($0.0860), showing firm selling pressure across all key moving averages.
Highlights
- MOVE trades at $0.0308, well below its MA-20 ($0.0354), MA-50 ($0.0360), and MA-200 ($0.0860), signaling dominant multi-term selling pressure.
- Momentum indicators (MACD daily/weekly, ADX downtrend, Bear Power, CCI –61.64) and an 8.33% daily drop confirm persistent short-term bearishness despite oversold readings (RSI D1: 43.20, W1: 29.82, Stoch RSI: 18.99).
- Near-term range is expected at $0.0280–$0.0340 with dynamic resistance at the Ichimoku Kijun ($0.0413); probability of further declines exceeds 80% unless MOVE reclaims $0.0340.
Oversold signals deepen as volatility and selling persist
The closest dynamic resistance for MOVE is the Ichimoku Kijun at $0.0413, with no significant support from major moving averages nearby. Technical momentum remains weak: daily and weekly MACD readings indicate sustained bearish pressure, while the daily ADX, despite a 'Buy' label, confirms an active downtrend. Oscillators are in oversold territory, with D1 RSI at 43.20, W1 RSI at 29.82, Stochastic RSI at 18.99 (oversold), and CCI at –61.64 (sell), though persistent seller dominance is reinforced by Bull/Bear Power at –0.0002 (sell). The Awesome Oscillator is neutral. MOVE’s price action sits near the lower end of today’s range, reflecting high volatility and consistent selling after the open, with oversold conditions introducing a potential note of caution.
Downside risk prevails as range narrows and buying fades
For the next five trading days, the expected volatility band relative to current levels is $0.0280 – $0.0340. The likelihood of a price increase is very low (less than 20%), so further downside is favored. The baseline scenario is consolidation within this range, pending a break. Should MOVE sustain a move above $0.0340, a rally toward the Ichimoku Kijun at $0.0413 is possible; if it drops firmly below $0.0280, additional declines toward new lows may follow.
Last time, analysts noted that MOVE is trading below its short medium and long-term moving averages, indicating prevailing downward pressure across all timeframes. Mixed momentum signals and overbought oscillators highlight a risk of short-term pullback, with strong selling pressure evident as the price sits near immediate support and well under dynamic resistance.


-
 Afghanistan
-
 Albania
-
 Algeria
-
 Angola
-
 Argentina
-
 Armenia
-
 Australia
-
 Austria
-
 Azerbaijan
-
 Bahamas
-
 Bahrain
-
 Bangladesh
-
 Belarus
-
 Belgium
-
 Bolivia
-
 Botswana
-
 Brazil
-
 Brunei
-
 Bulgaria
-
 Cambodia
-
 Cameroon
-
 Canada
-
 Chile
Chile
-
 China
China
-
 Colombia
-
 Congo
Congo
-
 Costa Rica
-
 Cote d'Ivoire
-
 Croatia
-
 Cuba
Cuba
-
 Cyprus
-
 Czechia
-
 DR Congo
-
 Denmark
-
 Dominican Republic
-
 Ecuador
-
 Egypt
Egypt
-
 El Salvador
-
 Estonia
-
 Eswatini
-
 Ethiopia
-
 Finland
-
 France
-
 Georgia
-
 Germany
-
 Ghana
Ghana
-
 Greece
-
 Haiti
Haiti
-
 Hong Kong
-
 Hungary
-
 India
India
-
 Indonesia
-
 Iran, Islamic republic
-
 Iraq
Iraq
-
 Ireland
-
 Israel
-
 Italy
Italy
-
 Jamaica
-
 Japan
Japan
-
 Jordan
-
 Kazakhstan
-
 Kenya
Kenya
-
 Korea
Korea
-
 Kuwait
-
 Kyrgyzstan
-
 Laos
Laos
-
 Latvia
-
 Lebanon
-
 Lesotho
-
 Libya
Libya
-
 Lithuania
-
 Luxembourg
-
 Madagascar
-
 Malaysia
-
 Malta
Malta
-
 Mauritius
-
 Mexico
-
 Moldova
-
 Mongolia
-
 Montenegro
-
 Morocco
-
 Mozambique
-
 Myanmar
-
 Namibia
-
 Nepal
Nepal
-
 Netherlands
-
 New Zealand
-
 Nigeria
-
 North Macedonia
-
 Norway
-
 Oman
Oman
-
 Pakistan
-
 Palestine
-
 Panama
-
 Papua New Guinea
-
 Paraguay
-
 Peru
Peru
-
 Philippines
-
 Poland
-
 Portugal
-
 Puerto Rico
-
 Qatar
Qatar
-
 Reunion
-
 Romania
-
 Rwanda
-
 Saudi Arabia
-
 Serbia
-
 Singapore
-
 Slovakia
-
 Slovenia
-
 Somalia
-
 South Africa
-
 Spain
Spain
-
 Sri Lanka
-
 Sweden
-
 Switzerland
-
 Syria
Syria
-
 Taiwan
-
 Tajikistan
-
 Tanzania
-
 Thailand
-
 Trinidad and Tobago
-
 Tunisia
-
 Turkey
-
 UAE
UAE
-
 Uganda
-
 Ukraine
-
 United Kingdom
-
United States
-
 Uruguay
-
 Uzbekistan
-
 Venezuela
-
 Vietnam
-
 Yemen
Yemen
-
 Zambia
-
 Zimbabwe
- Forex
- Crypto
