
Render price prediction: Will oversold technicals trigger a rebound? RNDR slides 9.58%

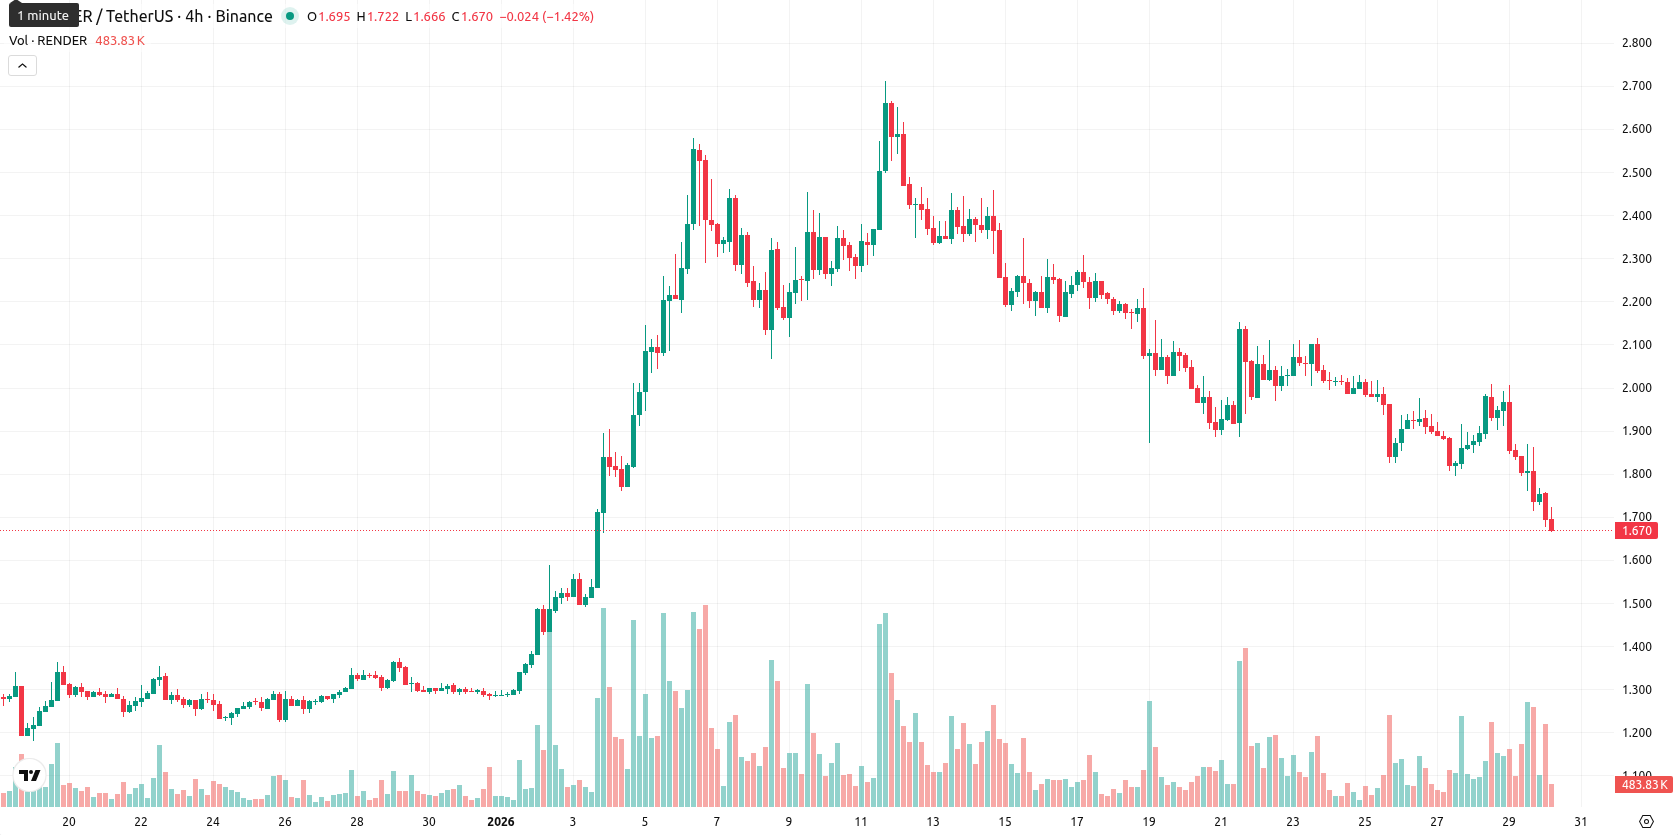
Render (RNDR) is trading at $1.671, which is below its MA-20 ($2.0981), MA-50 ($1.7655), and MA-200 ($2.7581). This configuration reflects strong short-, medium-, and long-term downward pressure, with the nearest dynamic resistance identified at the Ichimoku Kijun level of $2.2125.
 1.499
1.5650
1.499
1.5650
Highlights
- Render has decisively broken above the upper trendline of a falling wedge, signaling reduced selling pressure and a potential short-term directional shift.
- After an extended decline, this technical breakout suggests the possibility of stabilization, but does not yet confirm a sustained reversal.
- RNDR is trading at $1.671, below key MAs and facing resistance at $1.85 and $2.2125, with technical signals indicating continued seller dominance and a high probability of further downside.
Reduced selling pressure as wedge breakout tempers extended decline
Recent news shows that Render has broken above the upper trendline of a falling wedge pattern after an extended decline, indicating a reduction in selling pressure and a possible short-term change in direction.
Oversold signals persist as intraday volatility and seller control increase
Momentum signals are weak, as the ADX indicates a lack of strong trend and the MACD is neutral on the daily chart. The RSI, Commodity Channel Index, and Stochastic RSI all point to oversold conditions, suggesting prevailing seller dominance. Bull/Bear Power remains slightly positive on the daily timeframe, but this is contradicted by its "Sell" forecast across lower intervals, supporting seller strength overall. The Awesome Oscillator is neutral, not confirming the downtrend. RNDR opened just below the previous close without a significant gap and is now near the lower end of today’s range, with daily volatility assessed as high and continued intraday downward pressure.
Downward bias likely as upside probabilities remain limited
Over the next five trading days, the expected price range is $1.60 to $1.85, reflecting typical volatility for RNDR at current levels. Based on daily and weekly indicators, the probability of a price increase is very low (less than 20%), making further declines more likely within this period. In the baseline scenario, the price consolidates around current levels inside this range. A bullish outcome would require RNDR to reclaim and hold above resistance at $1.85, opening space toward $2.00. Conversely, a bearish scenario is likely if the price closes below $1.60, triggering further downside risk.
Last time, analysts noted that Render traded below its short- and long-term moving averages while hovering just above medium-term support, indicating sustained bearish pressure and heightened volatility. Momentum indicators remain mixed but skew slightly oversold, with resistance at the $2.10 Ichimoku Kijun level and sellers continuing to control the price action.








-
 Afghanistan
-
 Albania
-
 Algeria
-
 Angola
-
 Argentina
-
 Armenia
-
 Australia
-
 Austria
-
 Azerbaijan
-
 Bahamas
-
 Bahrain
-
 Bangladesh
-
 Belarus
-
 Belgium
-
 Bolivia
-
 Botswana
-
 Brazil
-
 Brunei
-
 Bulgaria
-
 Cambodia
-
 Cameroon
-
 Canada
-
 Chile
Chile
-
 China
China
-
 Colombia
-
 Congo
Congo
-
 Costa Rica
-
 Cote d'Ivoire
-
 Croatia
-
 Cuba
Cuba
-
 Cyprus
-
 Czechia
-
 DR Congo
-
 Denmark
-
 Dominican Republic
-
 Ecuador
-
 Egypt
Egypt
-
 El Salvador
-
 Estonia
-
 Eswatini
-
 Ethiopia
-
 Finland
-
 France
-
 Georgia
-
 Germany
-
 Ghana
Ghana
-
 Greece
-
 Haiti
Haiti
-
 Hong Kong
-
 Hungary
-
 India
India
-
 Indonesia
-
 Iran, Islamic republic
-
 Iraq
Iraq
-
 Ireland
-
 Israel
-
 Italy
Italy
-
 Jamaica
-
 Japan
Japan
-
 Jordan
-
 Kazakhstan
-
 Kenya
Kenya
-
 Korea
Korea
-
 Kuwait
-
 Kyrgyzstan
-
 Laos
Laos
-
 Latvia
-
 Lebanon
-
 Lesotho
-
 Libya
Libya
-
 Lithuania
-
 Luxembourg
-
 Madagascar
-
 Malaysia
-
 Malta
Malta
-
 Mauritius
-
 Mexico
-
 Moldova
-
 Mongolia
-
 Montenegro
-
 Morocco
-
 Mozambique
-
 Myanmar
-
 Namibia
-
 Nepal
Nepal
-
 Netherlands
-
 New Zealand
-
 Nigeria
-
 North Macedonia
-
 Norway
-
 Oman
Oman
-
 Pakistan
-
 Palestine
-
 Panama
-
 Papua New Guinea
-
 Paraguay
-
 Peru
Peru
-
 Philippines
-
 Poland
-
 Portugal
-
 Puerto Rico
-
 Qatar
Qatar
-
 Reunion
-
 Romania
-
 Rwanda
-
 Saudi Arabia
-
 Serbia
-
 Singapore
-
 Slovakia
-
 Slovenia
-
 Somalia
-
 South Africa
-
 Spain
Spain
-
 Sri Lanka
-
 Sweden
-
 Switzerland
-
 Syria
Syria
-
 Taiwan
-
 Tajikistan
-
 Tanzania
-
 Thailand
-
 Trinidad and Tobago
-
 Tunisia
-
 Turkey
-
 UAE
UAE
-
 Uganda
-
 Ukraine
-
 United Kingdom
-
United States
-
 Uruguay
-
 Uzbekistan
-
 Venezuela
-
 Vietnam
-
 Yemen
Yemen
-
 Zambia
-
 Zimbabwe
- Forex
- Crypto












