
Shiba Inu: Weak trend signals and oversold oscillators drive further losses

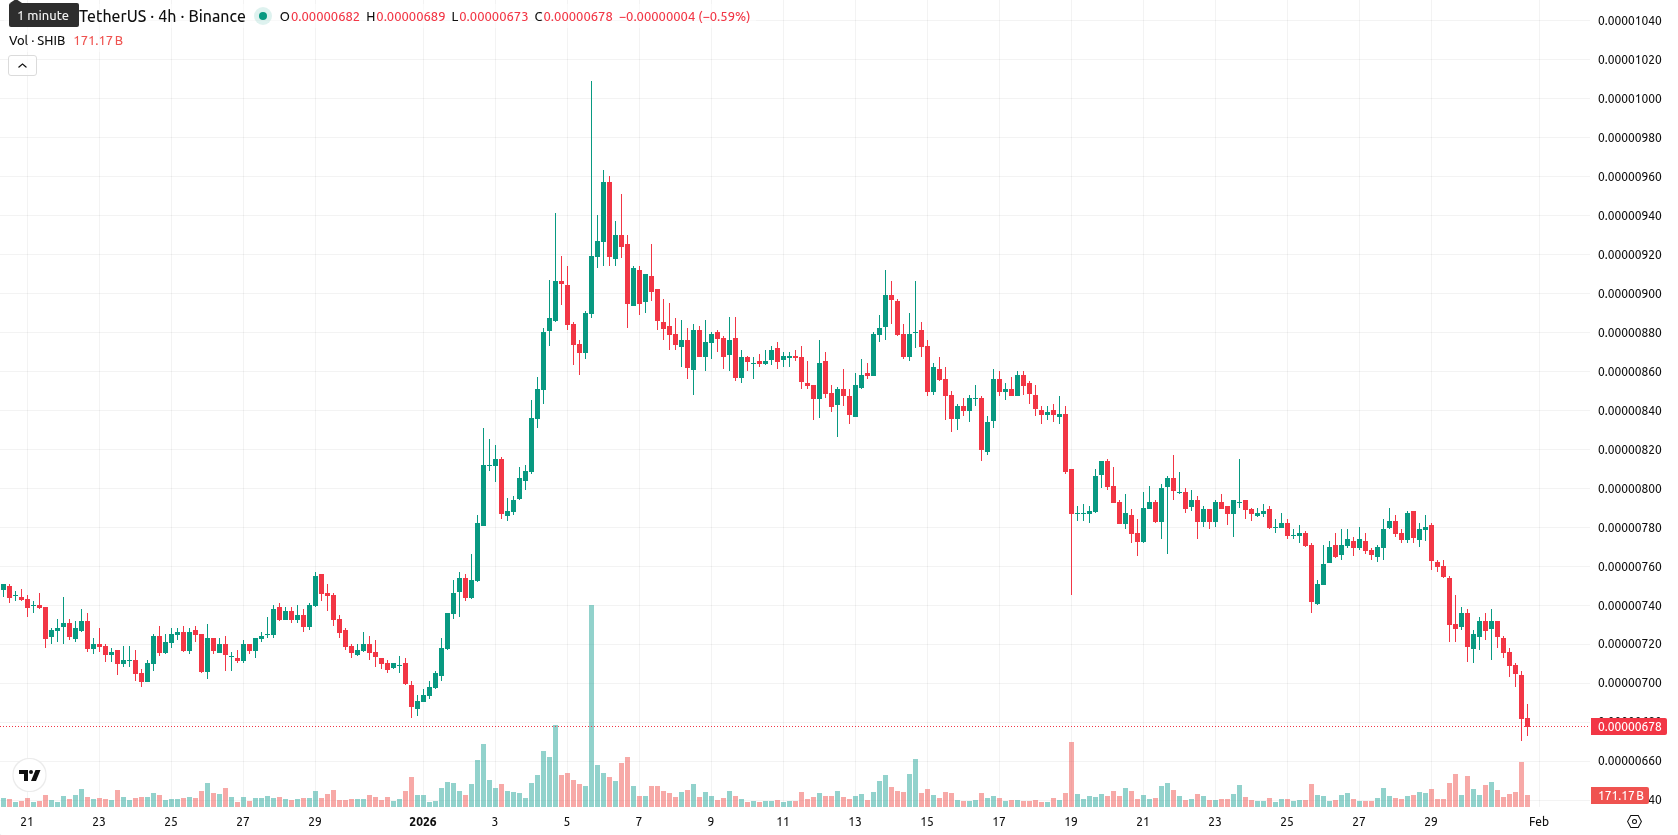
Shiba Inu (SHIB) is trading at $0.000007, which is below the MA-20 ($0.00000804), MA-50 ($0.00000791), and MA-200 ($0.00001054). This confirms persistent selling pressure across short-, medium-, and long-term timeframes, with the nearest dynamic resistance at the Ichimoku Kijun ($0.00000864) and support focused on the round $0.000007 handle.
Highlights
- SHIB trades at $0.000007, remaining below all major moving averages (MA-20, MA-50, MA-200), reinforcing persistent selling pressure across all timeframes.
- Momentum indicators such as MACD, ADX, RSI, and Stochastic RSI signal continued bearish momentum with oversold conditions and low volatility after a 7.10% intraday drop.
- Key technical levels are support at $0.000007 and $0.00000665, resistance at $0.00000825 and $0.00000864, with further downside likely unless SHIB reclaims resistance.
Oversold signals and weak momentum reinforce bearish tone
Momentum indicators show negative signals: MACD points to continued bearish momentum and ADX reveals a weak trend. Both RSI and CCI are entering oversold territory, and Stochastic RSI signals oversold conditions as well. Bull/Bear Power remains bearish, highlighting that sellers dominate intraday price action. The Awesome Oscillator also aligns with the downtrend. Today’s session saw the price open with no gap at $0.0000072, slipping to $0.000007, a drop of 7.10%, with trading pinned near the session low inside a very narrow range, indicating low volatility and renewed pressure after the open. This significant price drop is consistent with the momentum and oscillator signals, which together confirm the ongoing negative tone.
Further downside likely as bearish signals overwhelm reversal odds
Looking ahead, the expected range for the next 5 sessions is $0.00000665 to $0.00000825, keeping the price within the typical volatility band relative to current levels and reflecting recent volatility. The probability of a price increase is very low (less than 20%), making a further decrease much more likely given the widespread bearish signals on the daily and weekly charts. Baseline scenario: SHIB oscillates sideways between $0.00000665 and $0.00000825 until a trend catalyst emerges. Bullish scenario: recovery above $0.00000864 could bring resistance at $0.00000825 into play, though this is unlikely near term. Bearish scenario: a clear break below $0.00000665 may trigger further downside pressure.
Last time, analysts noted that Shiba Inu is maintaining a bearish trajectory, trading well below all key weekly moving averages and encountering persistent resistance, as sellers retain control amid weak momentum and oversold oscillators. Technical indicators, including RSI and ADX, suggest limited upside potential with expectations for continued consolidation within a narrow trading range unless a decisive breakout occurs.


-
 Afghanistan
-
 Albania
-
 Algeria
-
 Angola
-
 Argentina
-
 Armenia
-
 Australia
-
 Austria
-
 Azerbaijan
-
 Bahamas
-
 Bahrain
-
 Bangladesh
-
 Belarus
-
 Belgium
-
 Bolivia
-
 Botswana
-
 Brazil
-
 Brunei
-
 Bulgaria
-
 Cambodia
-
 Cameroon
-
 Canada
-
 Chile
Chile
-
 China
China
-
 Colombia
-
 Congo
Congo
-
 Costa Rica
-
 Cote d'Ivoire
-
 Croatia
-
 Cuba
Cuba
-
 Cyprus
-
 Czechia
-
 DR Congo
-
 Denmark
-
 Dominican Republic
-
 Ecuador
-
 Egypt
Egypt
-
 El Salvador
-
 Estonia
-
 Eswatini
-
 Ethiopia
-
 Finland
-
 France
-
 Georgia
-
 Germany
-
 Ghana
Ghana
-
 Greece
-
 Haiti
Haiti
-
 Hong Kong
-
 Hungary
-
 India
India
-
 Indonesia
-
 Iran, Islamic republic
-
 Iraq
Iraq
-
 Ireland
-
 Israel
-
 Italy
Italy
-
 Jamaica
-
 Japan
Japan
-
 Jordan
-
 Kazakhstan
-
 Kenya
Kenya
-
 Korea
Korea
-
 Kuwait
-
 Kyrgyzstan
-
 Laos
Laos
-
 Latvia
-
 Lebanon
-
 Lesotho
-
 Libya
Libya
-
 Lithuania
-
 Luxembourg
-
 Madagascar
-
 Malaysia
-
 Malta
Malta
-
 Mauritius
-
 Mexico
-
 Moldova
-
 Mongolia
-
 Montenegro
-
 Morocco
-
 Mozambique
-
 Myanmar
-
 Namibia
-
 Nepal
Nepal
-
 Netherlands
-
 New Zealand
-
 Nigeria
-
 North Macedonia
-
 Norway
-
 Oman
Oman
-
 Pakistan
-
 Palestine
-
 Panama
-
 Papua New Guinea
-
 Paraguay
-
 Peru
Peru
-
 Philippines
-
 Poland
-
 Portugal
-
 Puerto Rico
-
 Qatar
Qatar
-
 Reunion
-
 Romania
-
 Rwanda
-
 Saudi Arabia
-
 Serbia
-
 Singapore
-
 Slovakia
-
 Slovenia
-
 Somalia
-
 South Africa
-
 Spain
Spain
-
 Sri Lanka
-
 Sweden
-
 Switzerland
-
 Syria
Syria
-
 Taiwan
-
 Tajikistan
-
 Tanzania
-
 Thailand
-
 Trinidad and Tobago
-
 Tunisia
-
 Turkey
-
 UAE
UAE
-
 Uganda
-
 Ukraine
-
 United Kingdom
-
United States
-
 Uruguay
-
 Uzbekistan
-
 Venezuela
-
 Vietnam
-
 Yemen
Yemen
-
 Zambia
-
 Zimbabwe
- Forex
- Crypto
