
Movement falls 7.12% as oversold signals and firm selling persist

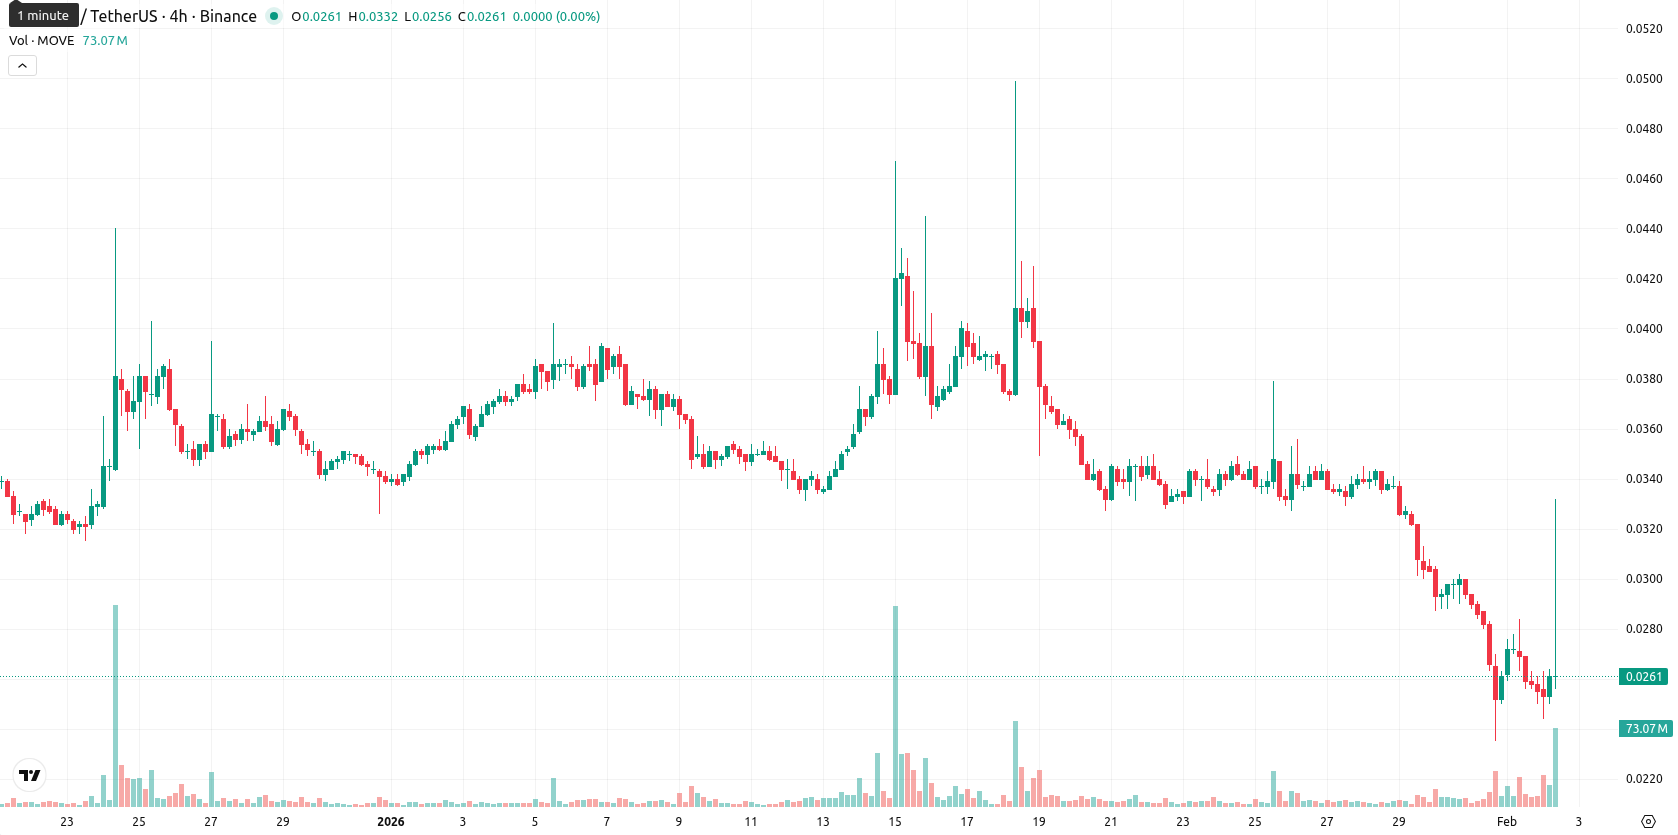
Movement (MOVE) is trading at $0.0261 after a daily drop of 7.12%, with the current price sitting well below the MA-20 ($0.0341), MA-50 ($0.0351), and MA-200 ($0.0835). This positions MOVE under notable downward pressure across short, medium, and long-term moving averages.
Highlights
- MOVE trades at $0.0261, well below its MA-20 ($0.0341), MA-50 ($0.0351), and MA-200 ($0.0835), indicating persistent downward pressure on all major timeframes.
- Momentum and trend indicators, including MACD, Bull/Bear Power, and an ADX-confirmed strong trend, show prevailing seller dominance with no confirmed reversal yet.
- Oversold readings from RSI (26.95), CCI (-187.07), and Stochastic RSI (0.0000) suggest downside exhaustion, but technicals point to consolidation between $0.0245–$0.0285 with risk skewed to further declines.
Intensified bearish momentum as indicators confirm persistent selling
Momentum signals confirm prevailing bearishness — both the MACD and Bull/Bear Power underline seller dominance, while the ADX on the daily chart points to a strong ongoing trend. The Ichimoku Kijun level serves as the nearest resistance at $0.0367 and immediate Ichimoku support is absent in the current range. Oversold readings from the RSI (26.95), Commodity Channel Index (-187.07), and Stochastic RSI (0.0000) reflect stretched downside conditions, but reversal signals remain unconfirmed. The Awesome Oscillator reinforces the sell trend, and MOVE trades near the lower end of today’s range ($0.0244 – $0.0332), indicating high volatility and sustained selling pressure.
Consolidation likely as bearish bias weighs on outlook
For the next five trading days, MOVE is expected to fluctuate within a typical volatility band between $0.0245 and $0.0285. Downside risk dominates, with less than a 20% probability of a meaningful price increase. The most probable scenario is consolidation within this range; however, a bullish move could see the price reclaim $0.0285 and approach $0.0300 if buyers return. If MOVE breaks below $0.0245, further losses may occur should selling pressure persist.
Last time, analysts noted that Movement (MOVE) remains under significant downward pressure, trading well below all major moving averages with high volatility and closing near session lows after a sharp decline. Momentum and oscillator signals including MACD, RSI, and Stochastic RSI reinforce a persistent bearish outlook, with no immediate signs of reversal and strong dynamic resistance near the $0.0400 level.


-
 Afghanistan
-
 Albania
-
 Algeria
-
 Angola
-
 Argentina
-
 Armenia
-
 Australia
-
 Austria
-
 Azerbaijan
-
 Bahamas
-
 Bahrain
-
 Bangladesh
-
 Belarus
-
 Belgium
-
 Bolivia
-
 Botswana
-
 Brazil
-
 Brunei
-
 Bulgaria
-
 Cambodia
-
 Cameroon
-
 Canada
-
 Chile
Chile
-
 China
China
-
 Colombia
-
 Congo
Congo
-
 Costa Rica
-
 Cote d'Ivoire
-
 Croatia
-
 Cuba
Cuba
-
 Cyprus
-
 Czechia
-
 DR Congo
-
 Denmark
-
 Dominican Republic
-
 Ecuador
-
 Egypt
Egypt
-
 El Salvador
-
 Estonia
-
 Eswatini
-
 Ethiopia
-
 Finland
-
 France
-
 Georgia
-
 Germany
-
 Ghana
Ghana
-
 Greece
-
 Haiti
Haiti
-
 Hong Kong
-
 Hungary
-
 India
India
-
 Indonesia
-
 Iran, Islamic republic
-
 Iraq
Iraq
-
 Ireland
-
 Israel
-
 Italy
Italy
-
 Jamaica
-
 Japan
Japan
-
 Jordan
-
 Kazakhstan
-
 Kenya
Kenya
-
 Korea
Korea
-
 Kuwait
-
 Kyrgyzstan
-
 Laos
Laos
-
 Latvia
-
 Lebanon
-
 Lesotho
-
 Libya
Libya
-
 Lithuania
-
 Luxembourg
-
 Madagascar
-
 Malaysia
-
 Malta
Malta
-
 Mauritius
-
 Mexico
-
 Moldova
-
 Mongolia
-
 Montenegro
-
 Morocco
-
 Mozambique
-
 Myanmar
-
 Namibia
-
 Nepal
Nepal
-
 Netherlands
-
 New Zealand
-
 Nigeria
-
 North Macedonia
-
 Norway
-
 Oman
Oman
-
 Pakistan
-
 Palestine
-
 Panama
-
 Papua New Guinea
-
 Paraguay
-
 Peru
Peru
-
 Philippines
-
 Poland
-
 Portugal
-
 Puerto Rico
-
 Qatar
Qatar
-
 Reunion
-
 Romania
-
 Rwanda
-
 Saudi Arabia
-
 Serbia
-
 Singapore
-
 Slovakia
-
 Slovenia
-
 Somalia
-
 South Africa
-
 Spain
Spain
-
 Sri Lanka
-
 Sweden
-
 Switzerland
-
 Syria
Syria
-
 Taiwan
-
 Tajikistan
-
 Tanzania
-
 Thailand
-
 Trinidad and Tobago
-
 Tunisia
-
 Turkey
-
 UAE
UAE
-
 Uganda
-
 Ukraine
-
 United Kingdom
-
United States
-
 Uruguay
-
 Uzbekistan
-
 Venezuela
-
 Vietnam
-
 Yemen
Yemen
-
 Zambia
-
 Zimbabwe
- Forex
- Crypto
