
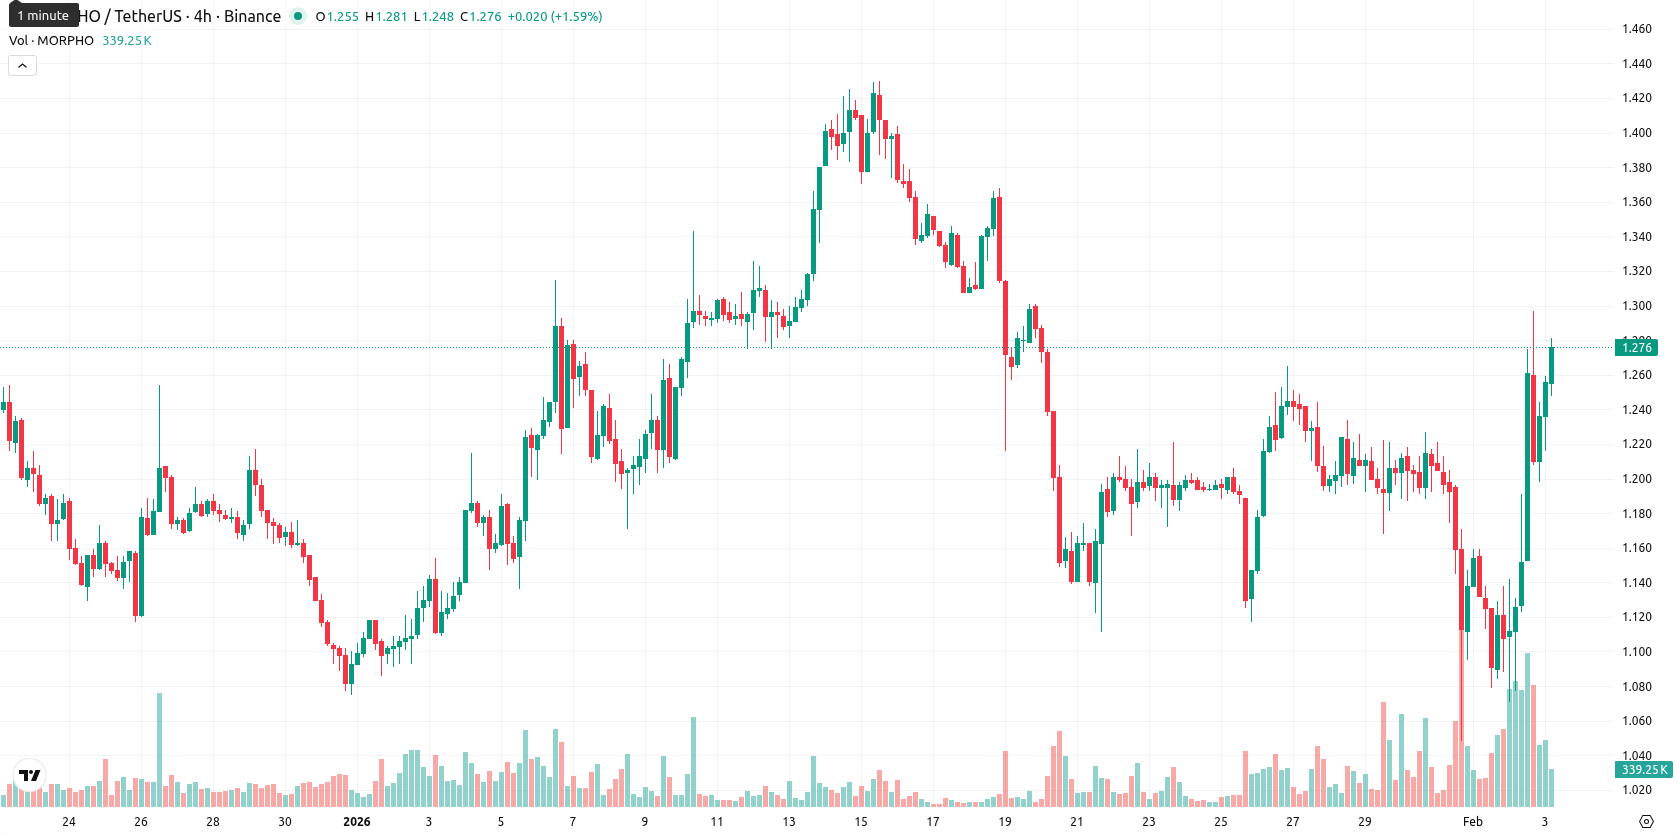
+14.59% for Morpho — volatility spikes amid resistance at $1.30

Morpho (MORPHO) is trading at $1.272, which is above both the MA-20 ($1.2334) and MA-50 ($1.2110), but remains well below the MA-200 ($1.6972). This setup indicates bullish momentum in the short to medium term, while the longer-term trend is still under downward pressure; the nearest dynamic support level is at the Ichimoku Kijun ($1.2395), with resistance likely forming around the MA-50 and near the $1.30 round level.
Highlights
- MORPHO is trading at $1.272, above the MA-20 ($1.2334) and MA-50 ($1.2110) but below the MA-200 ($1.6972), indicating short-term bullish momentum within a longer-term downtrend.
- Intraday volatility remains high after a 14.59% gap-up rally, with strong buyer dominance in bull/bear power, but mixed signals from oscillators advise caution.
- Key levels for the coming week are resistance at $1.30 and support at the Ichimoku Kijun ($1.2395), with low probability of a price increase and risk of downside if support fails.
Divergent momentum and oscillators as buyer strength challenges caution
Momentum signals are mixed: the MACD on the daily chart signals a sell, while the ADX shows weak trend strength with a neutral read. The Relative Strength Index is just above neutral at 51 and bullish, but the Stochastic RSI is overbought at 100, and the Commodity Channel Index remains neutral. Bull/Bear Power shows a strong buy, highlighting firm buyer dominance in intraday trading. The Awesome Oscillator signals a sell, which contrasts with the visible buyer strength. After opening with a gap up from $1.11 to $1.236, MORPHO has rallied 14.59%, currently trading near today’s high; intraday volatility is high, and the prevailing tone is one of continued strength toward the highs. Divergence between oscillators and momentum indicators suggests some caution is warranted, but price action and intraday signals confirm ongoing upward pressure.
Downside risk grows as probability of rally remains low
For the coming week, the typical volatility band for MORPHO is expected to be between $1.21 and $1.39, encompassing typical volatility for the asset. Based on the current weekly indicators, the probability of a price increase is very low (less than 20%), making further declines more likely unless buyers regain control. The baseline scenario sees MORPHO consolidating within a sideways corridor around current levels. A bullish scenario could develop if the price decisively breaks above $1.30 resistance, while a bearish outcome would come into play if the price drops below Ichimoku Kijun support at $1.2395, with increased downside risk.
Previously it was reported that Morpho (MORPHO) is exhibiting a bullish short- and medium-term structure as the price holds above its 20- and 50-day moving averages, while still facing longer-term downward pressure below the 200-day MA; immediate support aligns with the Ichimoku Kijun and resistance is near the $1.275 round level. Despite a strong intraday rally and buyer dominance in short-term momentum, daily chart signals are mixed with overbought oscillators and weak directional conviction, indicating a risk of near-term pullback or consolidation.


-
 Afghanistan
-
 Albania
-
 Algeria
-
 Angola
-
 Argentina
-
 Armenia
-
 Australia
-
 Austria
-
 Azerbaijan
-
 Bahamas
-
 Bahrain
-
 Bangladesh
-
 Belarus
-
 Belgium
-
 Bolivia
-
 Botswana
-
 Brazil
-
 Brunei
-
 Bulgaria
-
 Cambodia
-
 Cameroon
-
 Canada
-
 Chile
Chile
-
 China
China
-
 Colombia
-
 Congo
Congo
-
 Costa Rica
-
 Cote d'Ivoire
-
 Croatia
-
 Cuba
Cuba
-
 Cyprus
-
 Czechia
-
 DR Congo
-
 Denmark
-
 Dominican Republic
-
 Ecuador
-
 Egypt
Egypt
-
 El Salvador
-
 Estonia
-
 Eswatini
-
 Ethiopia
-
 Finland
-
 France
-
 Georgia
-
 Germany
-
 Ghana
Ghana
-
 Greece
-
 Haiti
Haiti
-
 Hong Kong
-
 Hungary
-
 India
India
-
 Indonesia
-
 Iran, Islamic republic
-
 Iraq
Iraq
-
 Ireland
-
 Israel
-
 Italy
Italy
-
 Jamaica
-
 Japan
Japan
-
 Jordan
-
 Kazakhstan
-
 Kenya
Kenya
-
 Korea
Korea
-
 Kuwait
-
 Kyrgyzstan
-
 Laos
Laos
-
 Latvia
-
 Lebanon
-
 Lesotho
-
 Libya
Libya
-
 Lithuania
-
 Luxembourg
-
 Madagascar
-
 Malaysia
-
 Malta
Malta
-
 Mauritius
-
 Mexico
-
 Moldova
-
 Mongolia
-
 Montenegro
-
 Morocco
-
 Mozambique
-
 Myanmar
-
 Namibia
-
 Nepal
Nepal
-
 Netherlands
-
 New Zealand
-
 Nigeria
-
 North Macedonia
-
 Norway
-
 Oman
Oman
-
 Pakistan
-
 Palestine
-
 Panama
-
 Papua New Guinea
-
 Paraguay
-
 Peru
Peru
-
 Philippines
-
 Poland
-
 Portugal
-
 Puerto Rico
-
 Qatar
Qatar
-
 Reunion
-
 Romania
-
 Rwanda
-
 Saudi Arabia
-
 Serbia
-
 Singapore
-
 Slovakia
-
 Slovenia
-
 Somalia
-
 South Africa
-
 Spain
Spain
-
 Sri Lanka
-
 Sweden
-
 Switzerland
-
 Syria
Syria
-
 Taiwan
-
 Tajikistan
-
 Tanzania
-
 Thailand
-
 Trinidad and Tobago
-
 Tunisia
-
 Turkey
-
 UAE
UAE
-
 Uganda
-
 Ukraine
-
 United Kingdom
-
United States
-
 Uruguay
-
 Uzbekistan
-
 Venezuela
-
 Vietnam
-
 Yemen
Yemen
-
 Zambia
-
 Zimbabwe
- Forex
- Crypto
