
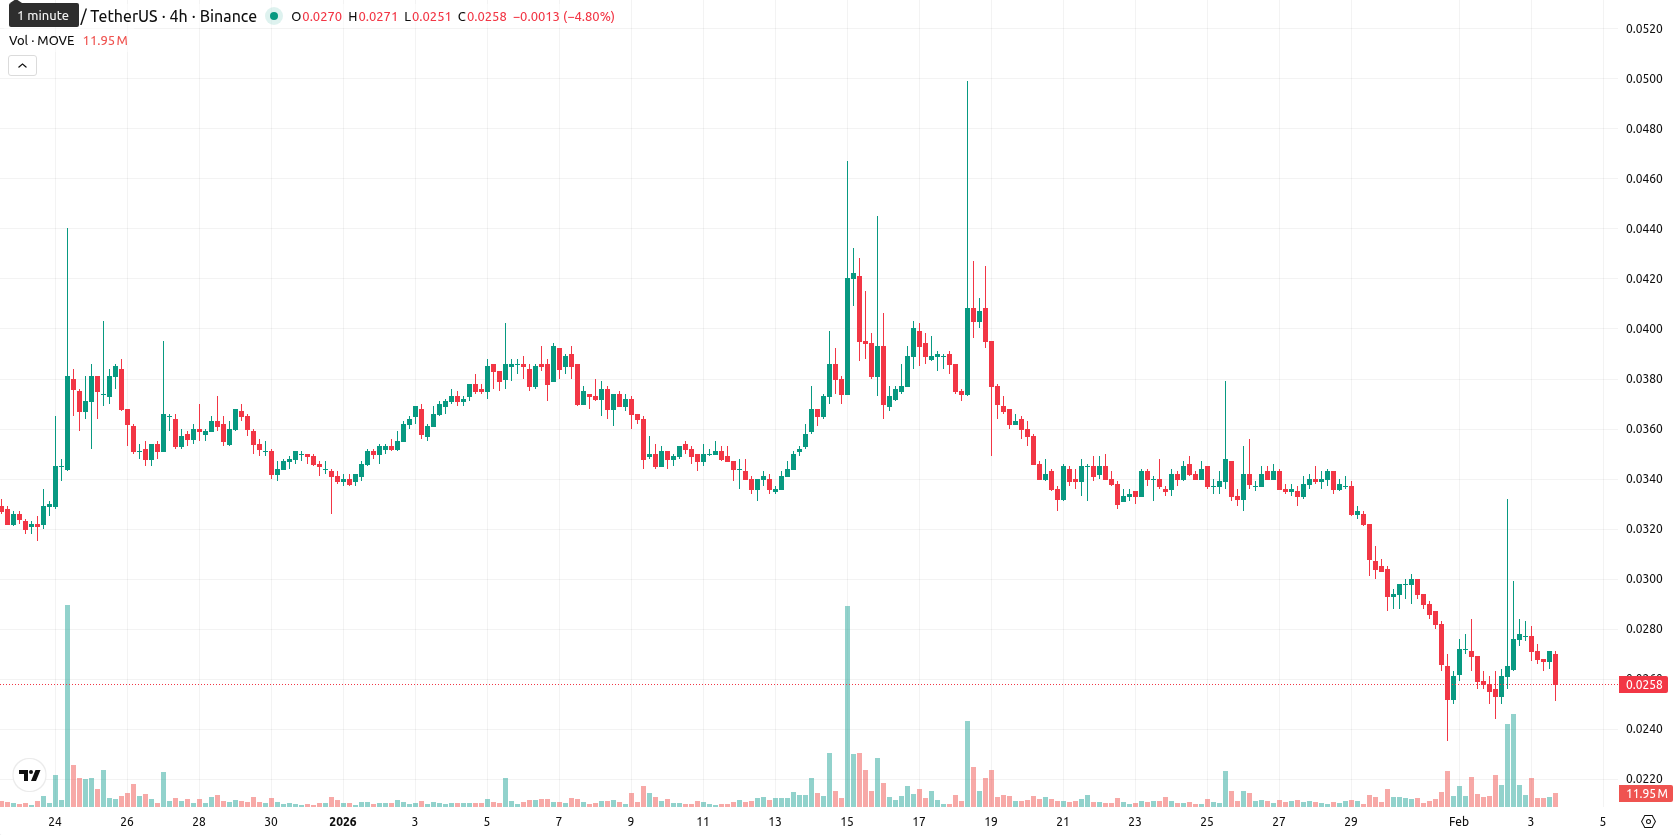
Movement: Bearish momentum and lost support drive 8.9% daily slide

Movement (MOVE) is trading at $0.0256, down 8.9% for the day and currently near today’s low. The asset sits below the MA-20 ($0.0337), MA-50 ($0.0348), and MA-200 ($0.0829), confirming sustained pressure across all observed timeframes.
Highlights
- MOVE trades at $0.0256, well below the MA-20 ($0.0337), MA-50 ($0.0348), and MA-200 ($0.0829), signaling multi-horizon bearish pressure.
- Momentum indicators including MACD, RSI in the lower 30s, and the Awesome Oscillator all indicate continued selling pressure with oversold conditions.
- Expected five-day price range is $0.0240–$0.0285; probability of an upward move is under 20% unless MOVE breaks above the $0.0367 Ichimoku Kijun resistance.
Oversold readings and weak support as sellers dominate
Technical analysis shows MOVE faces resistance at the Ichimoku Kijun level of $0.0367, with no nearby dynamic support levels above the market. Persistent downward momentum is confirmed by negative MACD and RSI signals, while the Average Directional Index points to mild but present trend activity. Leading oscillators including RSI in the lower 30s, a deeply oversold Commodity Channel Index, and Stochastic RSI buy signals indicate the market is oversold, though Bull/Bear Power remains only slightly positive, and the Awesome Oscillator supports ongoing selling pressure.
Sideways bias likely as bearish signals limit rebound odds
Over the next five trading days, a typical volatility band for MOVE is forecasted between $0.0240 and $0.0285. The likelihood of an upward breakout is under 20%, given overwhelming sell signals from RSI, MACD, and daily moving averages on both daily and weekly charts. The base case expects the price to trade sideways just above support, while a bullish breakout would need a move beyond resistance at $0.0367. Sustained weakness below $0.0240 could result if bearish momentum persists.
Previously it was reported that MOVE is trading below key moving averages, with persistent selling pressure confirmed by a broadly bearish setup and negative momentum indicators such as the MACD. Despite high volatility and oversold conditions highlighted by RSI, Stoch RSI, and CCI, the asset faces immediate resistance at the Ichimoku Kijun line while overall signals remain split between the potential for a short-term rebound and an ongoing downward bias.


-
 Afghanistan
-
 Albania
-
 Algeria
-
 Angola
-
 Argentina
-
 Armenia
-
 Australia
-
 Austria
-
 Azerbaijan
-
 Bahamas
-
 Bahrain
-
 Bangladesh
-
 Belarus
-
 Belgium
-
 Bolivia
-
 Botswana
-
 Brazil
-
 Brunei
-
 Bulgaria
-
 Cambodia
-
 Cameroon
-
 Canada
-
 Chile
Chile
-
 China
China
-
 Colombia
-
 Congo
Congo
-
 Costa Rica
-
 Cote d'Ivoire
-
 Croatia
-
 Cuba
Cuba
-
 Cyprus
-
 Czechia
-
 DR Congo
-
 Denmark
-
 Dominican Republic
-
 Ecuador
-
 Egypt
Egypt
-
 El Salvador
-
 Estonia
-
 Eswatini
-
 Ethiopia
-
 Finland
-
 France
-
 Georgia
-
 Germany
-
 Ghana
Ghana
-
 Greece
-
 Haiti
Haiti
-
 Hong Kong
-
 Hungary
-
 India
India
-
 Indonesia
-
 Iran, Islamic republic
-
 Iraq
Iraq
-
 Ireland
-
 Israel
-
 Italy
Italy
-
 Jamaica
-
 Japan
Japan
-
 Jordan
-
 Kazakhstan
-
 Kenya
Kenya
-
 Korea
Korea
-
 Kuwait
-
 Kyrgyzstan
-
 Laos
Laos
-
 Latvia
-
 Lebanon
-
 Lesotho
-
 Libya
Libya
-
 Lithuania
-
 Luxembourg
-
 Madagascar
-
 Malaysia
-
 Malta
Malta
-
 Mauritius
-
 Mexico
-
 Moldova
-
 Mongolia
-
 Montenegro
-
 Morocco
-
 Mozambique
-
 Myanmar
-
 Namibia
-
 Nepal
Nepal
-
 Netherlands
-
 New Zealand
-
 Nigeria
-
 North Macedonia
-
 Norway
-
 Oman
Oman
-
 Pakistan
-
 Palestine
-
 Panama
-
 Papua New Guinea
-
 Paraguay
-
 Peru
Peru
-
 Philippines
-
 Poland
-
 Portugal
-
 Puerto Rico
-
 Qatar
Qatar
-
 Reunion
-
 Romania
-
 Rwanda
-
 Saudi Arabia
-
 Serbia
-
 Singapore
-
 Slovakia
-
 Slovenia
-
 Somalia
-
 South Africa
-
 Spain
Spain
-
 Sri Lanka
-
 Sweden
-
 Switzerland
-
 Syria
Syria
-
 Taiwan
-
 Tajikistan
-
 Tanzania
-
 Thailand
-
 Trinidad and Tobago
-
 Tunisia
-
 Turkey
-
 UAE
UAE
-
 Uganda
-
 Ukraine
-
 United Kingdom
-
United States
-
 Uruguay
-
 Uzbekistan
-
 Venezuela
-
 Vietnam
-
 Yemen
Yemen
-
 Zambia
-
 Zimbabwe
- Forex
- Crypto
