
+9.48% for Toncoin — selling pressure persists with mixed momentum signals

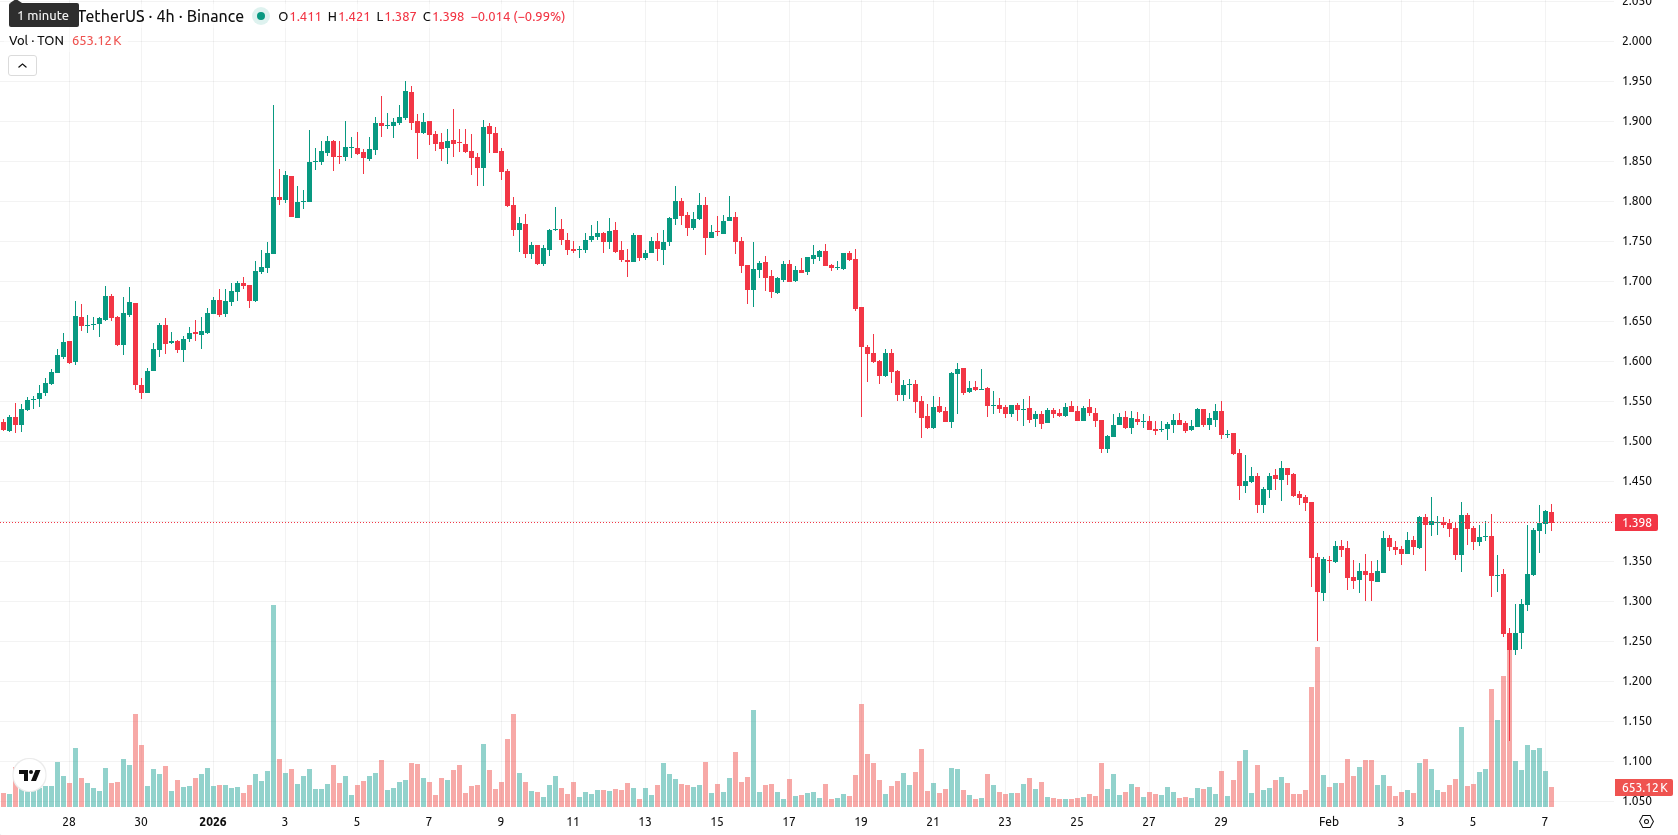
Toncoin (TON) is trading at $1.396, delivering a sharp daily gain of 9.48%. The asset remains below its MA-20 ($1.471), MA-50 ($1.597), and MA-200 ($2,318), signaling sustained selling pressure across all main timeframes.
Highlights
- TON is trading at $1.396, remaining below key moving averages (MA-20 $1.471, MA-50 $1.597, MA-200 $2.318) indicating sustained bearish pressure.
- MACD is negative and RSI at 41.5 with CCI in oversold territory, but Stochastic RSI is overbought, reflecting mixed momentum and potential short-term relief.
- Expected price range over the next five days is $1.33–$1.54 with probability of further increase below 20%, baseline scenario is sideways within this band.
Mixed momentum as resistance and oversold signals diverge
Technical momentum signals are mixed for TON: the MACD on D1 is negative and suggests continued weakness, while the ADX shows a moderate trend strength but aligns with a sell bias. RSI reads 41.5 and CCI is in oversold territory, indicating some potential for a relief bounce, but the Stochastic RSI is fully overbought. The nearest dynamic resistance is at the Ichimoku Kijun level ($1.471), while strong support clusters below recent session lows. Bull/Bear Power is slightly positive, hinting at minor intraday bullish momentum, while the Awesome Oscillator is neutral and not setting a clear directional tone.
Sideways outlook with downside risks as breakout thresholds narrow
Over the next five trading days, TON is likely to remain within a typical volatility band between $1.33 and $1.54, positioning the current price inside this expected range. There is less than a 20% probability of a further rise, making additional declines more probable. The baseline scenario is for TON to trade sideways between $1.33 and $1.54, with price action largely rangebound in the near term. If the asset breaks decisively above $1.47, a move to $1.54 could trigger stop-loss driven buying, while a drop below $1.33 could accelerate the downside as the broader trend remains negative.
Previously it was reported that Toncoin remains under sustained downward pressure, trading below all major moving averages with bearish momentum validated by MACD and ADX indicators. Despite a notable intraday price surge and deep oversold signals from RSI and Stoch RSI, technicals suggest potential for near-term stabilization but limited reversal prospects amid prevailing seller dominance.


Latest TON News


-
 Afghanistan
-
 Albania
-
 Algeria
-
 Angola
-
 Argentina
-
 Armenia
-
 Australia
-
 Austria
-
 Azerbaijan
-
 Bahamas
-
 Bahrain
-
 Bangladesh
-
 Belarus
-
 Belgium
-
 Bolivia
-
 Botswana
-
 Brazil
-
 Brunei
-
 Bulgaria
-
 Cambodia
-
 Cameroon
-
 Canada
-
 Chile
Chile
-
 China
China
-
 Colombia
-
 Congo
Congo
-
 Costa Rica
-
 Cote d'Ivoire
-
 Croatia
-
 Cuba
Cuba
-
 Cyprus
-
 Czechia
-
 DR Congo
-
 Denmark
-
 Dominican Republic
-
 Ecuador
-
 Egypt
Egypt
-
 El Salvador
-
 Estonia
-
 Eswatini
-
 Ethiopia
-
 Finland
-
 France
-
 Georgia
-
 Germany
-
 Ghana
Ghana
-
 Greece
-
 Haiti
Haiti
-
 Hong Kong
-
 Hungary
-
 India
India
-
 Indonesia
-
 Iran, Islamic republic
-
 Iraq
Iraq
-
 Ireland
-
 Israel
-
 Italy
Italy
-
 Jamaica
-
 Japan
Japan
-
 Jordan
-
 Kazakhstan
-
 Kenya
Kenya
-
 Korea
Korea
-
 Kuwait
-
 Kyrgyzstan
-
 Laos
Laos
-
 Latvia
-
 Lebanon
-
 Lesotho
-
 Libya
Libya
-
 Lithuania
-
 Luxembourg
-
 Madagascar
-
 Malaysia
-
 Malta
Malta
-
 Mauritius
-
 Mexico
-
 Moldova
-
 Mongolia
-
 Montenegro
-
 Morocco
-
 Mozambique
-
 Myanmar
-
 Namibia
-
 Nepal
Nepal
-
 Netherlands
-
 New Zealand
-
 Nigeria
-
 North Macedonia
-
 Norway
-
 Oman
Oman
-
 Pakistan
-
 Palestine
-
 Panama
-
 Papua New Guinea
-
 Paraguay
-
 Peru
Peru
-
 Philippines
-
 Poland
-
 Portugal
-
 Puerto Rico
-
 Qatar
Qatar
-
 Reunion
-
 Romania
-
 Rwanda
-
 Saudi Arabia
-
 Serbia
-
 Singapore
-
 Slovakia
-
 Slovenia
-
 Somalia
-
 South Africa
-
 Spain
Spain
-
 Sri Lanka
-
 Sweden
-
 Switzerland
-
 Syria
Syria
-
 Taiwan
-
 Tajikistan
-
 Tanzania
-
 Thailand
-
 Trinidad and Tobago
-
 Tunisia
-
 Turkey
-
 UAE
UAE
-
 Uganda
-
 Ukraine
-
 United Kingdom
-
United States
-
 Uruguay
-
 Uzbekistan
-
 Venezuela
-
 Vietnam
-
 Yemen
Yemen
-
 Zambia
-
 Zimbabwe
- Forex
- Crypto
