
Ethereum price prediction: Can exchange outflows bolster support? ETH consolidates below resistance

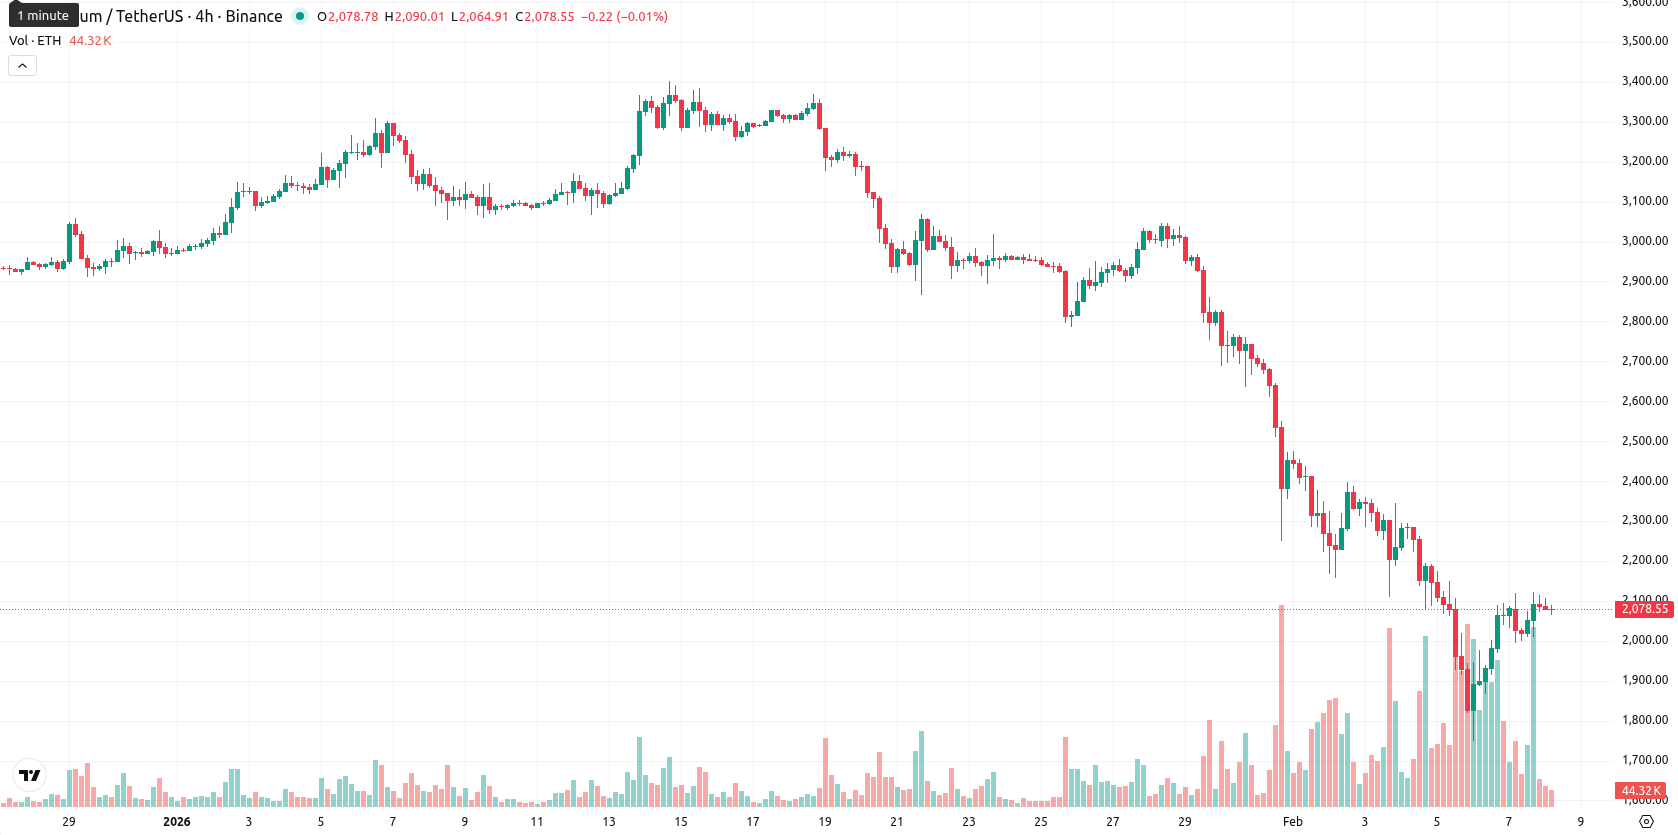
Ethereum (ETH) is trading at $2,084.90, well below the MA-20 ($2,635.61), MA-50 ($2,914.25), and MA-200 ($3,614.70), confirming strong downside momentum across all key timeframes. The current price is close to the middle of today’s intraday range, with moderate volatility and a consolidating tone.
Highlights
- Large Ethereum holders have shifted significant ETH to self-custody, reducing exchange reserves to multi-year lows near 16.3 million ETH as of February 2026.
- Shanghai-based Trend Research closed a $2 billion leveraged ETH position amid major wallet flows, while protocol upgrades and ETFs drive evolving institutional adoption.
- Ethereum trades at $2,084.90, well below key moving averages, with strong bearish momentum signaling high downside risk and a likely $1,980–$2,190 trading range.
Exchange outflows and leveraged position closures amid protocol upgrades
Large Ethereum holders have recently transferred substantial amounts of ETH to self-custody, pushing exchange reserves to multi-year lows near 16.3 million ETH as of February 2026. In addition, Trend Research, a Shanghai-based fund, reportedly closed a $2 billion leveraged ETH position amid significant movements between Binance and self-custody wallets. Ongoing protocol upgrades, such as the upcoming Pectra release and increased institutional adoption via ETFs and staking products, continue to shape the network’s technical and market landscape.
Bearish momentum sustains as ETH trades below support levels
The technical profile for Ethereum is decidedly bearish: the price remains pressured beneath all major moving averages, with resistance at the Ichimoku Kijun ($2,575.34) and immediate support at the MA-5 ($2,070.87). Momentum indicators on the daily chart are negative, with the MACD and Awesome Oscillator confirming weakness, ADX indicating a strong downtrend, and both the RSI (31.05) and CCI reflecting oversold conditions, while the Stochastic RSI sits near neutral. Bull/Bear Power signals dominant selling pressure, while price action remains consolidative intraday within a moderately volatile range.
Limited rebound prospects as downside risk dominates near-term range
For the next five sessions, ETH is expected to trade within a volatility band of $1,980 to $2,190, reflecting recent price behavior and prevailing momentum. Upside probability is very limited (below 20%), while the likelihood of a further downside remains high. Baseline expectation is sideways movement between $1,980 and $2,190, with a potential bullish break above $2,190 opening the way to $2,300 and a bearish close below $1,980 increasing the risk of a deeper correction.
Previously it was reported that Ethereum is exhibiting a decisive short-term bearish structure, with price action anchored below key moving averages, high sell-off volumes, and momentum indicators like RSI and MACD trending lower. While buyers are tentatively stepping in near current support zones, resistance above remains firm and market sentiment is broadly defensive, suggesting volatility and downside risks persist.


-
 Afghanistan
-
 Albania
-
 Algeria
-
 Angola
-
 Argentina
-
 Armenia
-
 Australia
-
 Austria
-
 Azerbaijan
-
 Bahamas
-
 Bahrain
-
 Bangladesh
-
 Belarus
-
 Belgium
-
 Bolivia
-
 Botswana
-
 Brazil
-
 Brunei
-
 Bulgaria
-
 Cambodia
-
 Cameroon
-
 Canada
-
 Chile
Chile
-
 China
China
-
 Colombia
-
 Congo
Congo
-
 Costa Rica
-
 Cote d'Ivoire
-
 Croatia
-
 Cuba
Cuba
-
 Cyprus
-
 Czechia
-
 DR Congo
-
 Denmark
-
 Dominican Republic
-
 Ecuador
-
 Egypt
Egypt
-
 El Salvador
-
 Estonia
-
 Eswatini
-
 Ethiopia
-
 Finland
-
 France
-
 Georgia
-
 Germany
-
 Ghana
Ghana
-
 Greece
-
 Haiti
Haiti
-
 Hong Kong
-
 Hungary
-
 India
India
-
 Indonesia
-
 Iran, Islamic republic
-
 Iraq
Iraq
-
 Ireland
-
 Israel
-
 Italy
Italy
-
 Jamaica
-
 Japan
Japan
-
 Jordan
-
 Kazakhstan
-
 Kenya
Kenya
-
 Korea
Korea
-
 Kuwait
-
 Kyrgyzstan
-
 Laos
Laos
-
 Latvia
-
 Lebanon
-
 Lesotho
-
 Libya
Libya
-
 Lithuania
-
 Luxembourg
-
 Madagascar
-
 Malaysia
-
 Malta
Malta
-
 Mauritius
-
 Mexico
-
 Moldova
-
 Mongolia
-
 Montenegro
-
 Morocco
-
 Mozambique
-
 Myanmar
-
 Namibia
-
 Nepal
Nepal
-
 Netherlands
-
 New Zealand
-
 Nigeria
-
 North Macedonia
-
 Norway
-
 Oman
Oman
-
 Pakistan
-
 Palestine
-
 Panama
-
 Papua New Guinea
-
 Paraguay
-
 Peru
Peru
-
 Philippines
-
 Poland
-
 Portugal
-
 Puerto Rico
-
 Qatar
Qatar
-
 Reunion
-
 Romania
-
 Rwanda
-
 Saudi Arabia
-
 Serbia
-
 Singapore
-
 Slovakia
-
 Slovenia
-
 Somalia
-
 South Africa
-
 Spain
Spain
-
 Sri Lanka
-
 Sweden
-
 Switzerland
-
 Syria
Syria
-
 Taiwan
-
 Tajikistan
-
 Tanzania
-
 Thailand
-
 Trinidad and Tobago
-
 Tunisia
-
 Turkey
-
 UAE
UAE
-
 Uganda
-
 Ukraine
-
 United Kingdom
-
United States
-
 Uruguay
-
 Uzbekistan
-
 Venezuela
-
 Vietnam
-
 Yemen
Yemen
-
 Zambia
-
 Zimbabwe
- Forex
- Crypto
