
Solana price prediction: Further downside likely as SOL struggles amid ETF exits

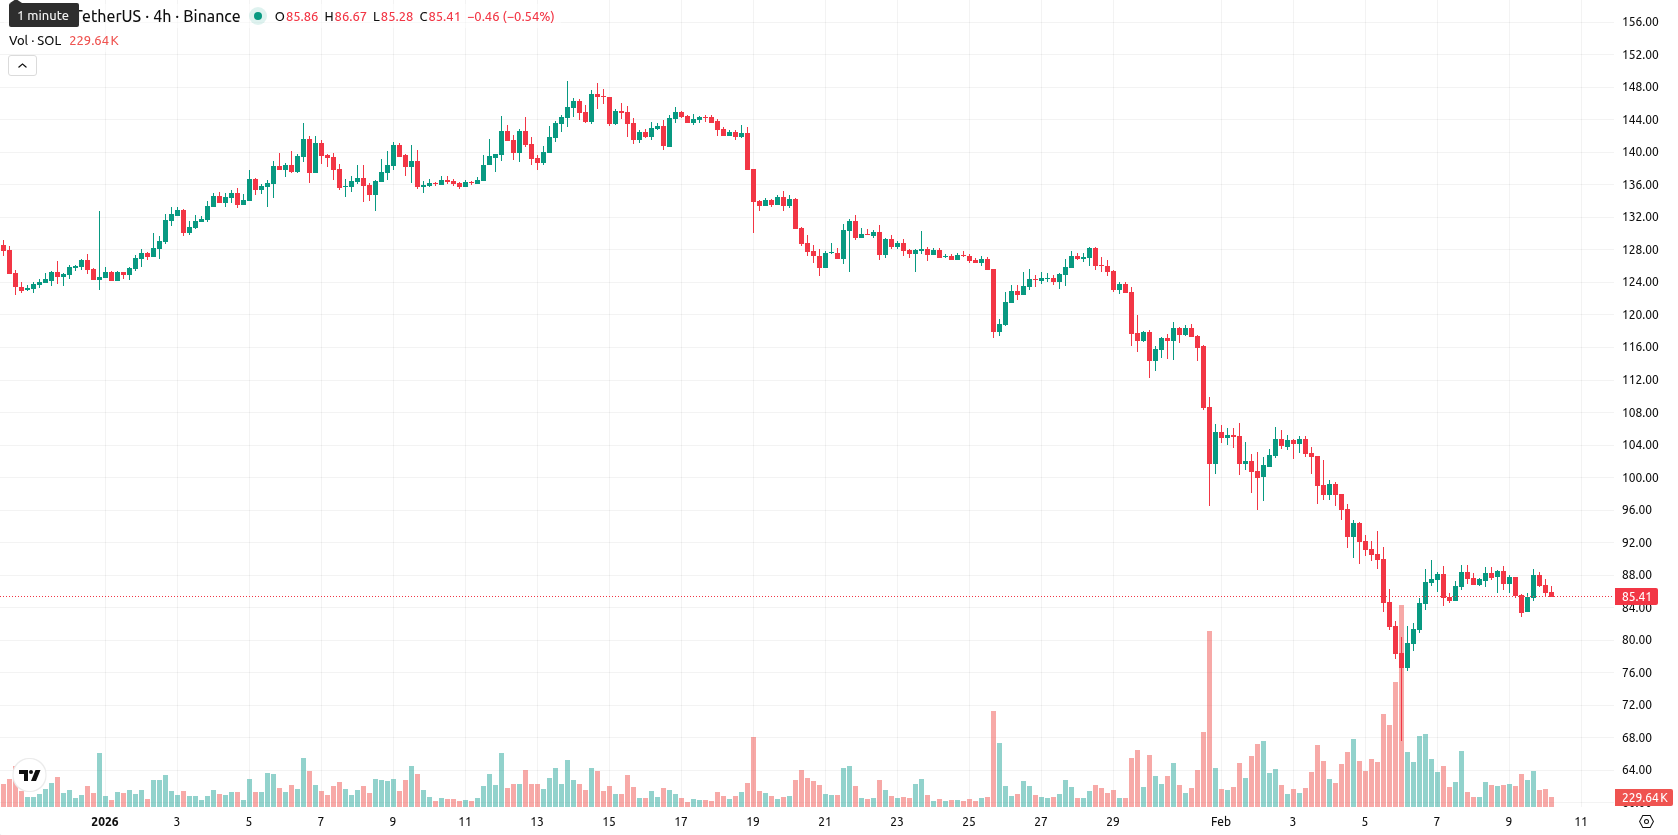
Solana (SOL) is trading at $85.49, which is well below the MA-20 ($108.60), MA-50 ($123.22), and MA-200 ($166.25), signaling sustained downward pressure across short-, medium-, and long-term timeframes. The nearest dynamic resistance is indicated by the Ichimoku Kijun at $107.12, while there is no immediate support on the daily charts.
Highlights
- Solana-linked ETFs saw record daily outflows of nearly $12 million as SOL prices declined, signaling a sharp drop in institutional participation.
- Sushi launched its decentralized exchange on Solana, expanding DeFi capabilities, while Solmate opted for a strategic partnership with RockawayX instead of a merger.
- SOL trades at $85.49, well below key moving averages, with prevailing bearish momentum and expected to consolidate between $81.00 and $90.00 over the next five days.
Institutional outflows and DeFi integrations reshape Solana ecosystem
Major Solana-linked ETFs recorded their largest daily outflows on record, with nearly $12 million in redemptions as prices declined, pointing to reduced institutional participation. Sushi, a leading decentralized exchange, launched on the Solana network, adding new DeFi capabilities and expanding user access. Solmate, a Solana Treasury firm, decided against a merger with RockawayX, opting for a strategic partnership focused on expansion due to market conditions affecting Solana.
Persistent intraday downside as bearish signals intensify across oscillators
Momentum remains decisively bearish according to the MACD (Sell) and ADX (Sell, 39.18) on the daily timeframe. Multiple oscillators point to oversold or selling conditions — namely, the RSI at 29.51, the Stochastic RSI and CCI also skewed toward oversold, and Bull/Bear Power deeply negative (–9.12), indicating sellers firmly control intraday momentum. The Awesome Oscillator further confirms the bearish bias. Today’s session reflects a decline of 0.71% ($0.61 lower), with no notable gap at the open; price action is near today’s lows within a moderately volatile range, suggesting persistent downside pressure from the open. There is little divergence across intraday signals, as bearish momentum and weak oscillators confirm the softness in today’s performance.
High downside risk persists while major resistance remains unchallenged
Looking ahead, the expected trading range for the next five days is adjusted to $81.00 — $90.00, representing a typical volatility band relative to current levels and the prevailing bearish sentiment. The probability of a further price decrease remains very high (more than 80%), while an upward reversal is less likely in the short term. The base scenario is for SOL to consolidate between $81 and $90 with limited attempts to move higher. A move above the Ichimoku Kijun resistance at $107.12 is necessary for any bullish breakout, while a drop below $81 could prompt an accelerated decline.
Previously it was reported that Solana remains under sustained bearish pressure, trading decisively below its key moving averages and major resistance at the Ichimoku Kijun, with technical oscillators such as RSI and MACD reinforcing ongoing sell conditions and oversold momentum. The asset is expected to remain weak and defensive within a narrow volatility band, with support near $82 and resistance around $107.97, while the likelihood of a bullish reversal remains low barring a significant move above current resistance levels.


-
 Afghanistan
-
 Albania
-
 Algeria
-
 Angola
-
 Argentina
-
 Armenia
-
 Australia
-
 Austria
-
 Azerbaijan
-
 Bahamas
-
 Bahrain
-
 Bangladesh
-
 Belarus
-
 Belgium
-
 Bolivia
-
 Botswana
-
 Brazil
-
 Brunei
-
 Bulgaria
-
 Cambodia
-
 Cameroon
-
 Canada
-
 Chile
Chile
-
 China
China
-
 Colombia
-
 Congo
Congo
-
 Costa Rica
-
 Cote d'Ivoire
-
 Croatia
-
 Cuba
Cuba
-
 Cyprus
-
 Czechia
-
 DR Congo
-
 Denmark
-
 Dominican Republic
-
 Ecuador
-
 Egypt
Egypt
-
 El Salvador
-
 Estonia
-
 Eswatini
-
 Ethiopia
-
 Finland
-
 France
-
 Georgia
-
 Germany
-
 Ghana
Ghana
-
 Greece
-
 Haiti
Haiti
-
 Hong Kong
-
 Hungary
-
 India
India
-
 Indonesia
-
 Iran, Islamic republic
-
 Iraq
Iraq
-
 Ireland
-
 Israel
-
 Italy
Italy
-
 Jamaica
-
 Japan
Japan
-
 Jordan
-
 Kazakhstan
-
 Kenya
Kenya
-
 Korea
Korea
-
 Kuwait
-
 Kyrgyzstan
-
 Laos
Laos
-
 Latvia
-
 Lebanon
-
 Lesotho
-
 Libya
Libya
-
 Lithuania
-
 Luxembourg
-
 Madagascar
-
 Malaysia
-
 Malta
Malta
-
 Mauritius
-
 Mexico
-
 Moldova
-
 Mongolia
-
 Montenegro
-
 Morocco
-
 Mozambique
-
 Myanmar
-
 Namibia
-
 Nepal
Nepal
-
 Netherlands
-
 New Zealand
-
 Nigeria
-
 North Macedonia
-
 Norway
-
 Oman
Oman
-
 Pakistan
-
 Palestine
-
 Panama
-
 Papua New Guinea
-
 Paraguay
-
 Peru
Peru
-
 Philippines
-
 Poland
-
 Portugal
-
 Puerto Rico
-
 Qatar
Qatar
-
 Reunion
-
 Romania
-
 Rwanda
-
 Saudi Arabia
-
 Serbia
-
 Singapore
-
 Slovakia
-
 Slovenia
-
 Somalia
-
 South Africa
-
 Spain
Spain
-
 Sri Lanka
-
 Sweden
-
 Switzerland
-
 Syria
Syria
-
 Taiwan
-
 Tajikistan
-
 Tanzania
-
 Thailand
-
 Trinidad and Tobago
-
 Tunisia
-
 Turkey
-
 UAE
UAE
-
 Uganda
-
 Ukraine
-
 United Kingdom
-
United States
-
 Uruguay
-
 Uzbekistan
-
 Venezuela
-
 Vietnam
-
 Yemen
Yemen
-
 Zambia
-
 Zimbabwe
- Forex
- Crypto
