
Jupiter: Bearish momentum and oversold signals cap 9.55% daily gain

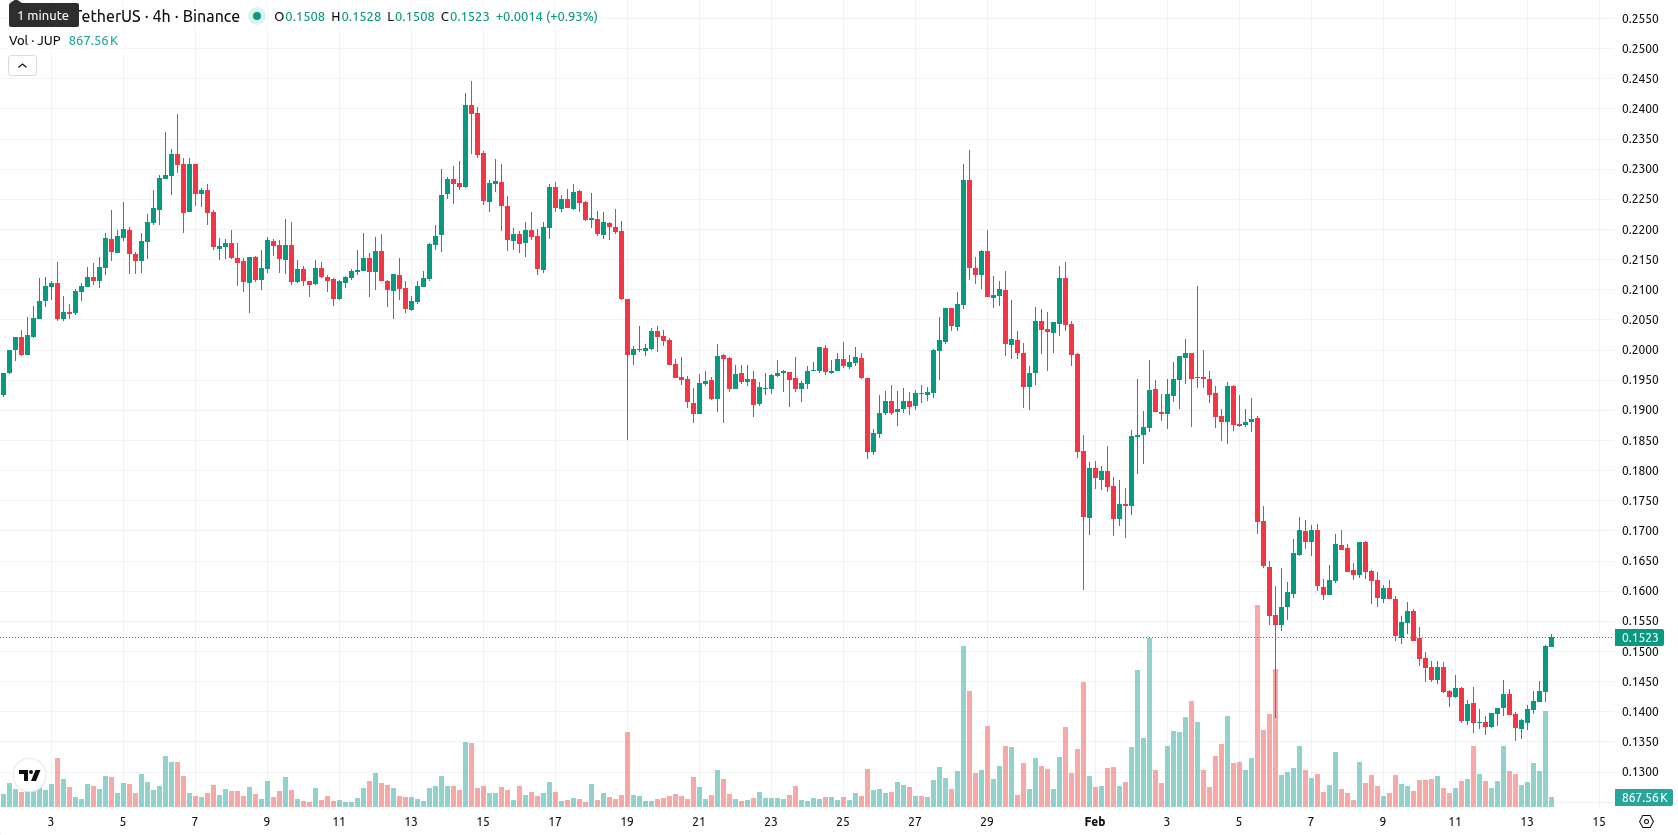
Jupiter (JUP) is trading at $0.1525 after a daily increase of $0.0133 (9.55%), placing the asset below its MA-20 ($0.1775), MA-50 ($0.1958), and MA-200 ($0.3436). This configuration highlights sustained selling pressure, as JUP continues to underperform across all major moving averages.
Highlights
- Jupiter Lend exited its six-month Beta phase with 83,000 users, having undergone seven security audits, formal verification, and reporting zero bad debts.
- To bolster security, Jupiter announced an audit competition for Jupiter Lend, featuring a $107,000 prize pool to attract further code scrutiny.
- JUP trades at $0.1525 below major moving averages, faces strong bearish momentum, and risks further decline if it drops beneath $0.1440 support.
Product relaunch and audit incentives as user base expands
Jupiter has officially concluded the Beta phase of its money market product, Jupiter Lend, following six months of development and testing. The platform now serves 83,000 users, has passed seven security audits and a formal verification, and has reported no bad debts to date. To encourage further scrutiny, Jupiter has launched an audit competition for Jupiter Lend with a prize pool of $107,000.
Oversold momentum signals as downside technical bias builds
Momentum signals remain weak for JUP, with both the MACD and ADX indicators confirming ongoing bearish conditions. Oversold readings on the RSI, Stochastic RSI, and CCI highlight underlying weakness, while Bull/Bear Power reflects mild seller control on the intraday chart. The nearest resistance is the Ichimoku Kijun level at $0.1841; immediate support is undefined but can be inferred near recent lows, suggesting that short-, medium-, and long-term trends are all tilted to the downside.
Downward breakout risk as volatility and bearish signals converge
Over the next five sessions, JUP is expected to trade within a volatility band of $0.1440–$0.1532 relative to current levels, reflecting recent price movements. Given that all four weekly directional indicators signal "Sell" or "Strong Sell," the probability of further declines remains high (over 80%). A move above the resistance at $0.1841 would improve the short-term outlook, while a drop below $0.1440 could accelerate downside risk.
Previously it was reported that Jupiter remains under pronounced selling pressure, trading well below all major moving averages with persistent bearish signals from the MACD, RSI, and multiple oscillators, all indicating oversold conditions. Momentum and price action confirm seller dominance, with immediate resistance at the Ichimoku Kijun level and limited prospects for a near-term rebound as weekly indicators continue to suggest elevated downside risk.


Latest Jupiter News


-
 Afghanistan
-
 Albania
-
 Algeria
-
 Angola
-
 Argentina
-
 Armenia
-
 Australia
-
 Austria
-
 Azerbaijan
-
 Bahamas
-
 Bahrain
-
 Bangladesh
-
 Belarus
-
 Belgium
-
 Bolivia
-
 Botswana
-
 Brazil
-
 Brunei
-
 Bulgaria
-
 Cambodia
-
 Cameroon
-
 Canada
-
 Chile
Chile
-
 China
China
-
 Colombia
-
 Congo
Congo
-
 Costa Rica
-
 Cote d'Ivoire
-
 Croatia
-
 Cuba
Cuba
-
 Cyprus
-
 Czechia
-
 DR Congo
-
 Denmark
-
 Dominican Republic
-
 Ecuador
-
 Egypt
Egypt
-
 El Salvador
-
 Estonia
-
 Eswatini
-
 Ethiopia
-
 Finland
-
 France
-
 Georgia
-
 Germany
-
 Ghana
Ghana
-
 Greece
-
 Haiti
Haiti
-
 Hong Kong
-
 Hungary
-
 India
India
-
 Indonesia
-
 Iran, Islamic republic
-
 Iraq
Iraq
-
 Ireland
-
 Israel
-
 Italy
Italy
-
 Jamaica
-
 Japan
Japan
-
 Jordan
-
 Kazakhstan
-
 Kenya
Kenya
-
 Korea
Korea
-
 Kuwait
-
 Kyrgyzstan
-
 Laos
Laos
-
 Latvia
-
 Lebanon
-
 Lesotho
-
 Libya
Libya
-
 Lithuania
-
 Luxembourg
-
 Madagascar
-
 Malaysia
-
 Malta
Malta
-
 Mauritius
-
 Mexico
-
 Moldova
-
 Mongolia
-
 Montenegro
-
 Morocco
-
 Mozambique
-
 Myanmar
-
 Namibia
-
 Nepal
Nepal
-
 Netherlands
-
 New Zealand
-
 Nigeria
-
 North Macedonia
-
 Norway
-
 Oman
Oman
-
 Pakistan
-
 Palestine
-
 Panama
-
 Papua New Guinea
-
 Paraguay
-
 Peru
Peru
-
 Philippines
-
 Poland
-
 Portugal
-
 Puerto Rico
-
 Qatar
Qatar
-
 Reunion
-
 Romania
-
 Rwanda
-
 Saudi Arabia
-
 Serbia
-
 Singapore
-
 Slovakia
-
 Slovenia
-
 Somalia
-
 South Africa
-
 Spain
Spain
-
 Sri Lanka
-
 Sweden
-
 Switzerland
-
 Syria
Syria
-
 Taiwan
-
 Tajikistan
-
 Tanzania
-
 Thailand
-
 Trinidad and Tobago
-
 Tunisia
-
 Turkey
-
 UAE
UAE
-
 Uganda
-
 Ukraine
-
 United Kingdom
-
United States
-
 Uruguay
-
 Uzbekistan
-
 Venezuela
-
 Vietnam
-
 Yemen
Yemen
-
 Zambia
-
 Zimbabwe
- Forex
- Crypto
