
Kava gains 7.65% as technicals point to potential rebound from oversold levels

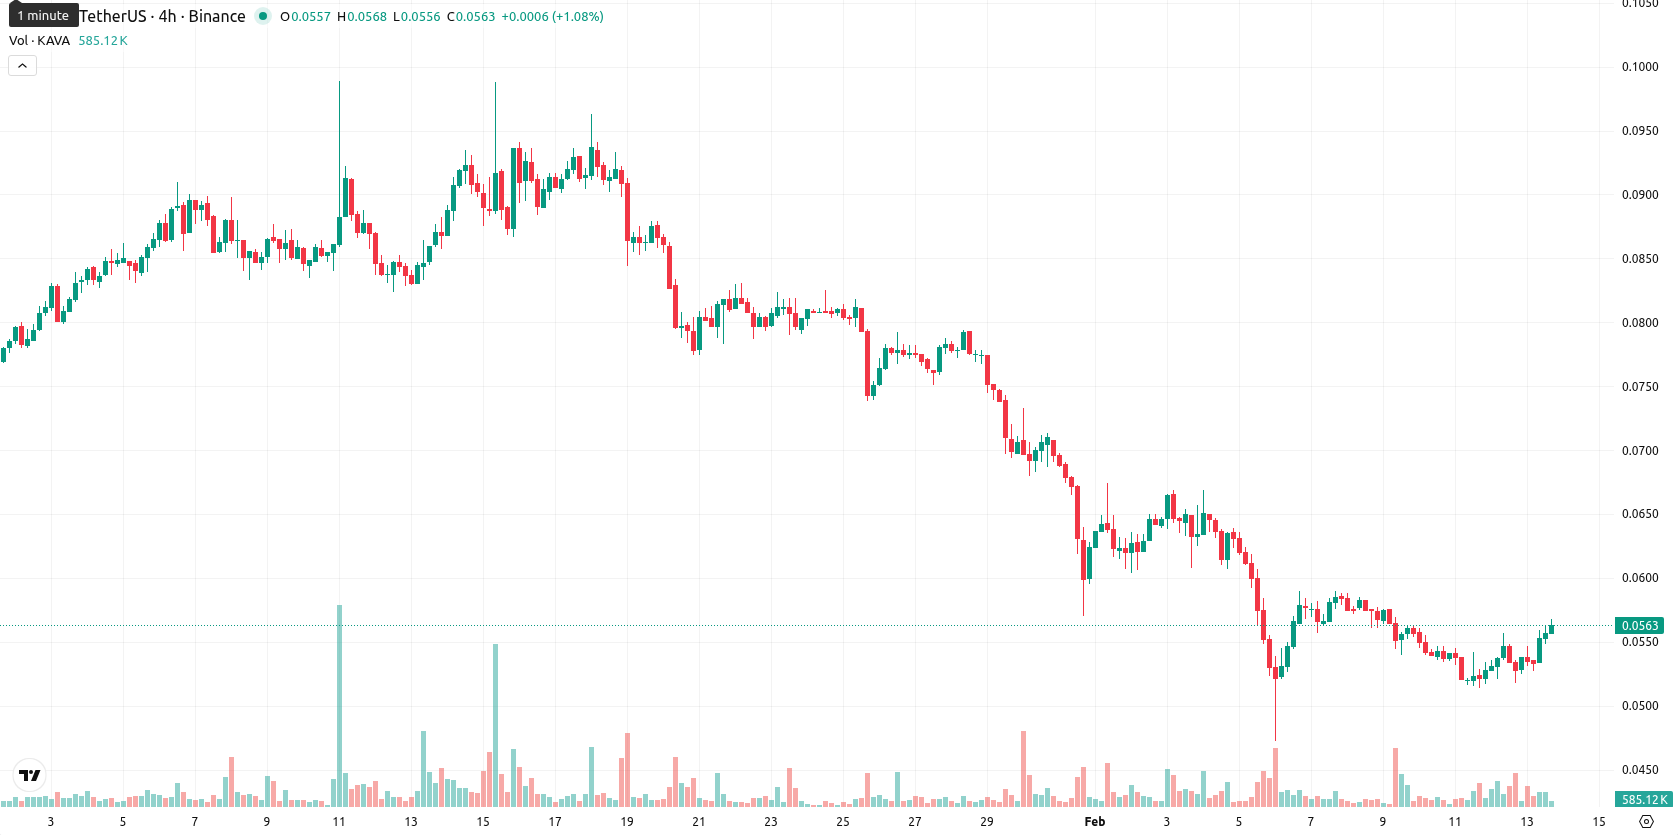
Kava (KAVA) is trading at $0.0563, remaining below the MA-20 ($0.0644), MA-50 ($0.0759), and MA-200 ($0.2005), confirming persistent short-, medium-, and long-term downward momentum and ongoing pressure from sellers.
Highlights
- KAVA remains in a persistent downtrend, trading at $0.0563 below the MA-20 ($0.0644), MA-50 ($0.0759), and MA-200 ($0.2005), confirming strong bearish pressure.
- RSI at 29.86 and CCI at -90.26 highlight that KAVA is in or near oversold territory, while momentum indicators, including the MACD and ADX, reinforce bearish dominance.
- Near-term resistance is at the Ichimoku Kijun ($0.0718) with support at $0.0527; a sustained move below $0.0540 could trigger further declines amid ongoing volatility.
Bearish momentum strengthens as oscillators confirm oversold conditions
The nearest dynamic resistance is provided by the Ichimoku Kijun at $0.0718, while immediate support can be observed near today's session low of $0.0527. Momentum indicators remain bearish on the daily timeframe, with the MACD signaling continued weakness and the ADX reflecting a relatively strong trend in favor of sellers. RSI at 29.86 and CCI at -90.26 confirm the asset is in or approaching oversold territory, while the Stochastic RSI is neutral near 70, suggesting potential for a pause or modest rebound as conditions are stretched. Bull/Bear Power shows sellers still have the upper hand intraday, and the Awesome Oscillator remains neutral.
Sideways trend risk prevails as volatility and oversold state align
For the next 5 trading days, the projected range for KAVA is $0.0540 to $0.0585, keeping price movements close to current levels amid a volatile backdrop. The probability of a price increase is very low (less than 20%), reflecting a broad dominance of bearish signals among the weekly indicators; further declines are much more likely. Baseline scenario: price continues sideways within the defined corridor as oversold readings and volatility lead to two-way swings. Bullish scenario: a close above $0.0570 could trigger a test of $0.0600, but this would require a sustained reversal in daily momentum. Bearish scenario: a break below $0.0540 opens the way toward lower support, as long-term downtrends remain in force.
Last time, analysts noted that Kava is experiencing persistent bearish momentum, trading well below all major moving averages with technical indicators such as RSI, MACD, and Stoch RSI confirming deeply oversold conditions and ongoing seller dominance. Immediate resistance sits near the Ichimoku Kijun, while support remains limited, indicating a high probability of continued consolidation or further downside within the current volatility range.


-
 Afghanistan
-
 Albania
-
 Algeria
-
 Angola
-
 Argentina
-
 Armenia
-
 Australia
-
 Austria
-
 Azerbaijan
-
 Bahamas
-
 Bahrain
-
 Bangladesh
-
 Belarus
-
 Belgium
-
 Bolivia
-
 Botswana
-
 Brazil
-
 Brunei
-
 Bulgaria
-
 Cambodia
-
 Cameroon
-
 Canada
-
 Chile
Chile
-
 China
China
-
 Colombia
-
 Congo
Congo
-
 Costa Rica
-
 Cote d'Ivoire
-
 Croatia
-
 Cuba
Cuba
-
 Cyprus
-
 Czechia
-
 DR Congo
-
 Denmark
-
 Dominican Republic
-
 Ecuador
-
 Egypt
Egypt
-
 El Salvador
-
 Estonia
-
 Eswatini
-
 Ethiopia
-
 Finland
-
 France
-
 Georgia
-
 Germany
-
 Ghana
Ghana
-
 Greece
-
 Haiti
Haiti
-
 Hong Kong
-
 Hungary
-
 India
India
-
 Indonesia
-
 Iran, Islamic republic
-
 Iraq
Iraq
-
 Ireland
-
 Israel
-
 Italy
Italy
-
 Jamaica
-
 Japan
Japan
-
 Jordan
-
 Kazakhstan
-
 Kenya
Kenya
-
 Korea
Korea
-
 Kuwait
-
 Kyrgyzstan
-
 Laos
Laos
-
 Latvia
-
 Lebanon
-
 Lesotho
-
 Libya
Libya
-
 Lithuania
-
 Luxembourg
-
 Madagascar
-
 Malaysia
-
 Malta
Malta
-
 Mauritius
-
 Mexico
-
 Moldova
-
 Mongolia
-
 Montenegro
-
 Morocco
-
 Mozambique
-
 Myanmar
-
 Namibia
-
 Nepal
Nepal
-
 Netherlands
-
 New Zealand
-
 Nigeria
-
 North Macedonia
-
 Norway
-
 Oman
Oman
-
 Pakistan
-
 Palestine
-
 Panama
-
 Papua New Guinea
-
 Paraguay
-
 Peru
Peru
-
 Philippines
-
 Poland
-
 Portugal
-
 Puerto Rico
-
 Qatar
Qatar
-
 Reunion
-
 Romania
-
 Rwanda
-
 Saudi Arabia
-
 Serbia
-
 Singapore
-
 Slovakia
-
 Slovenia
-
 Somalia
-
 South Africa
-
 Spain
Spain
-
 Sri Lanka
-
 Sweden
-
 Switzerland
-
 Syria
Syria
-
 Taiwan
-
 Tajikistan
-
 Tanzania
-
 Thailand
-
 Trinidad and Tobago
-
 Tunisia
-
 Turkey
-
 UAE
UAE
-
 Uganda
-
 Ukraine
-
 United Kingdom
-
United States
-
 Uruguay
-
 Uzbekistan
-
 Venezuela
-
 Vietnam
-
 Yemen
Yemen
-
 Zambia
-
 Zimbabwe
- Forex
- Crypto
