
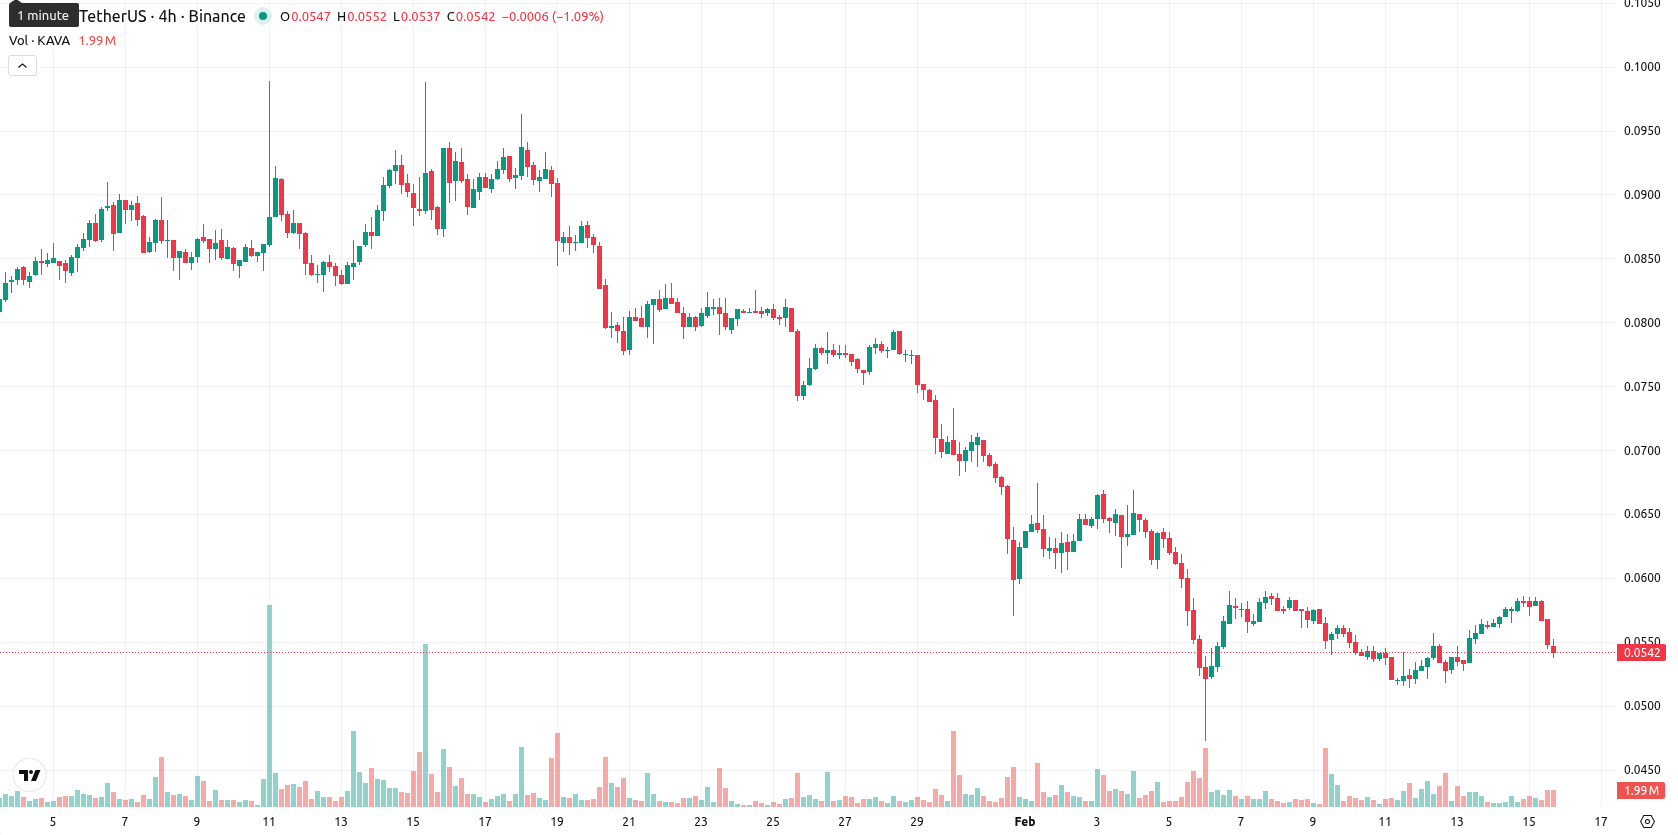
Bearish momentum and key average breakdown — Kava drops 7.24%

Kava (KAVA) is currently trading at $0.0538, clearly below key Moving Averages: MA-20 ($0.0623), MA-50 ($0.0752), and MA-200 ($0.1972), signaling sustained downside pressure in the short, medium, and long term. The nearest dynamic resistance is around the Ichimoku Kijun at $0.0671, with no immediate dynamic support visible; the overall structure confirms a prevailing bearish trend.
Highlights
- KAVA is trading at $0.0538, significantly below its MA-20 ($0.0623), MA-50 ($0.0752), and MA-200 ($0.1972), confirming sustained downside pressure.
- Momentum indicators such as daily and weekly MACD (Strong Sell), ADX (bearish), and RSI (D1: 38.94, W1: 21.99) reinforce the entrenched bearish trend.
- For the coming week, expected range is $0.0531–$0.0580, with an 80%+ probability of further decline and key resistance at the Ichimoku Kijun ($0.0671).
Momentum signals deepen downside bias amid persistent selling
Momentum indicators reinforce the negative outlook, with the MACD on daily and weekly timeframes flashing Strong Sell and the ADX on both timeframes indicating a solid bearish trend. The RSI sits at 38.94 (D1) and 21.99 (W1), paired with a daily Stochastic RSI extreme at 100, suggesting the market is overbought intraday despite being entrenched in a broader downtrend; CCI and Bull/Bear Power point to seller dominance. The daily session saw no significant gap at the open, and the price has fallen 7.24%, currently positioned near the low of today’s $0.0537 – $0.0585 range, reflecting high intraday volatility and persistent selling pressure.
High probability of further decline with limited rebound chances
For the coming week, the expected price range is $0.0531 to $0.0580, keeping movement closely tethered to current levels after accounting for typical volatility. The probability of further decline is very high (more than 80%), while a sustained rebound remains very unlikely. The baseline scenario is for the price to consolidate within the $0.0531 – $0.0580 band; bullish momentum would require a push above the Kijun ($0.0671), while a bearish break below $0.0531 could open the door to further declines.
Previously it was reported that Kava remains in a strong downtrend below all key moving averages, with daily technical indicators such as RSI, MACD, and ADX confirming persistent bearish momentum and oversold conditions. Immediate resistance is aligned with the Ichimoku Kijun, while support is just under current levels, suggesting any rebounds are likely to be limited amid ongoing seller dominance and heightened volatility.


-
 Afghanistan
-
 Albania
-
 Algeria
-
 Angola
-
 Argentina
-
 Armenia
-
 Australia
-
 Austria
-
 Azerbaijan
-
 Bahamas
-
 Bahrain
-
 Bangladesh
-
 Belarus
-
 Belgium
-
 Bolivia
-
 Botswana
-
 Brazil
-
 Brunei
-
 Bulgaria
-
 Cambodia
-
 Cameroon
-
 Canada
-
 Chile
Chile
-
 China
China
-
 Colombia
-
 Congo
Congo
-
 Costa Rica
-
 Cote d'Ivoire
-
 Croatia
-
 Cuba
Cuba
-
 Cyprus
-
 Czechia
-
 DR Congo
-
 Denmark
-
 Dominican Republic
-
 Ecuador
-
 Egypt
Egypt
-
 El Salvador
-
 Estonia
-
 Eswatini
-
 Ethiopia
-
 Finland
-
 France
-
 Georgia
-
 Germany
-
 Ghana
Ghana
-
 Greece
-
 Haiti
Haiti
-
 Hong Kong
-
 Hungary
-
 India
India
-
 Indonesia
-
 Iran, Islamic republic
-
 Iraq
Iraq
-
 Ireland
-
 Israel
-
 Italy
Italy
-
 Jamaica
-
 Japan
Japan
-
 Jordan
-
 Kazakhstan
-
 Kenya
Kenya
-
 Korea
Korea
-
 Kuwait
-
 Kyrgyzstan
-
 Laos
Laos
-
 Latvia
-
 Lebanon
-
 Lesotho
-
 Libya
Libya
-
 Lithuania
-
 Luxembourg
-
 Madagascar
-
 Malaysia
-
 Malta
Malta
-
 Mauritius
-
 Mexico
-
 Moldova
-
 Mongolia
-
 Montenegro
-
 Morocco
-
 Mozambique
-
 Myanmar
-
 Namibia
-
 Nepal
Nepal
-
 Netherlands
-
 New Zealand
-
 Nigeria
-
 North Macedonia
-
 Norway
-
 Oman
Oman
-
 Pakistan
-
 Palestine
-
 Panama
-
 Papua New Guinea
-
 Paraguay
-
 Peru
Peru
-
 Philippines
-
 Poland
-
 Portugal
-
 Puerto Rico
-
 Qatar
Qatar
-
 Reunion
-
 Romania
-
 Rwanda
-
 Saudi Arabia
-
 Serbia
-
 Singapore
-
 Slovakia
-
 Slovenia
-
 Somalia
-
 South Africa
-
 Spain
Spain
-
 Sri Lanka
-
 Sweden
-
 Switzerland
-
 Syria
Syria
-
 Taiwan
-
 Tajikistan
-
 Tanzania
-
 Thailand
-
 Trinidad and Tobago
-
 Tunisia
-
 Turkey
-
 UAE
UAE
-
 Uganda
-
 Ukraine
-
 United Kingdom
-
United States
-
 Uruguay
-
 Uzbekistan
-
 Venezuela
-
 Vietnam
-
 Yemen
Yemen
-
 Zambia
-
 Zimbabwe
- Forex
- Crypto
