
IOTA price prediction: Risk of accelerated decline as IOTA falls 7.20% to $0.0682

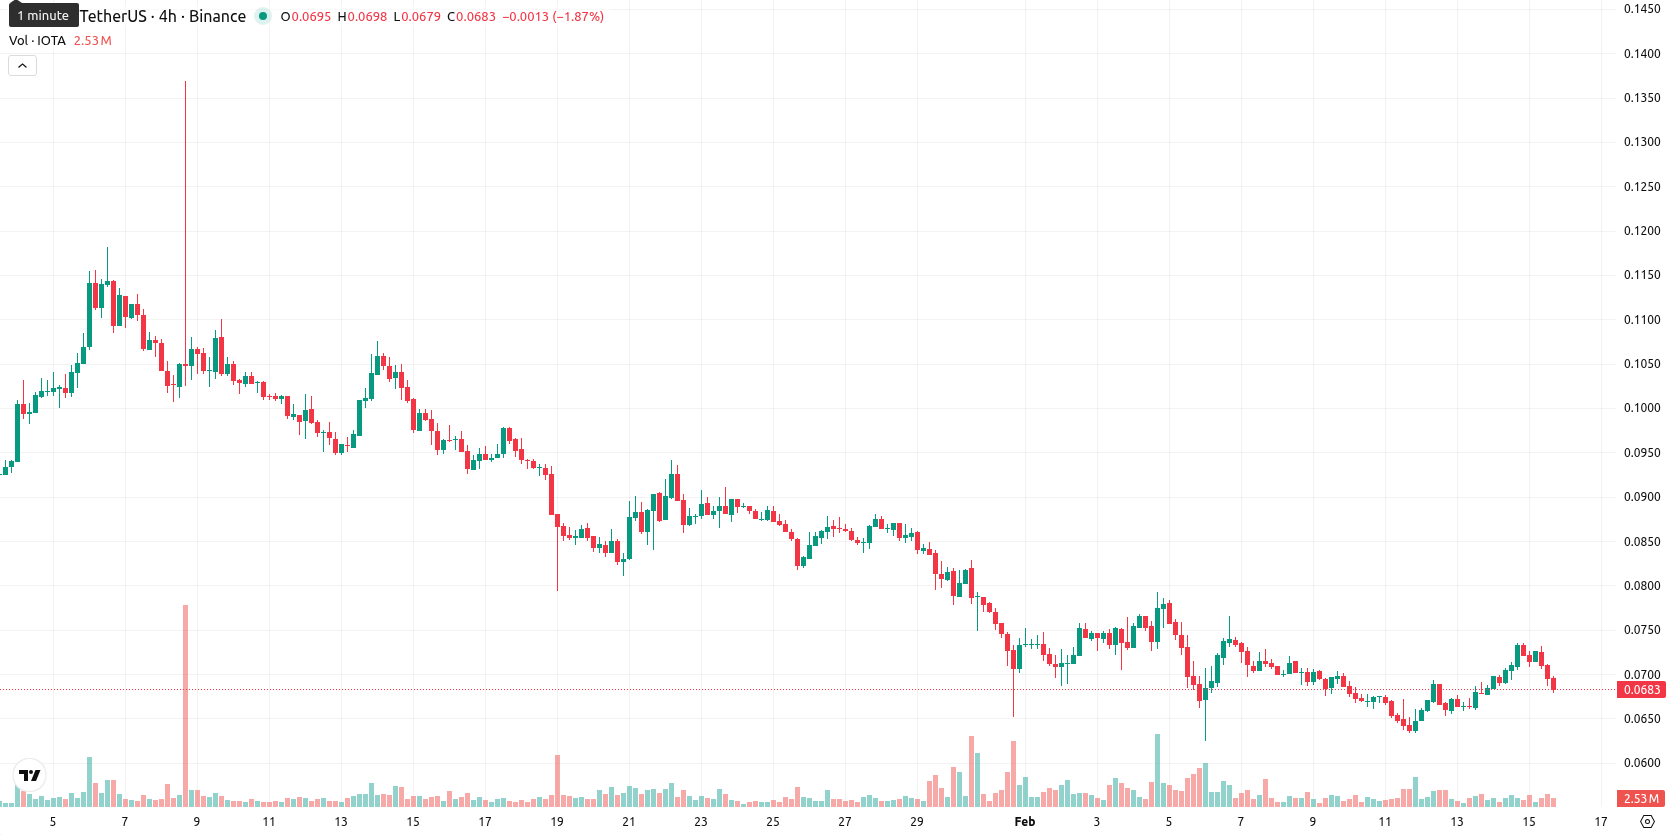
IOTA (IOTA) is trading at $0.0682, below the MA-20 ($0.0740), MA-50 ($0.0858), and MA-200 ($0.1377), indicating persistent bearish trends across short-, medium-, and long-term timeframes. The asset is moving decisively lower today, undercutting major averages in a sign of heavy downside pressure after the open.
Highlights
- IOTA trades at $0.0682, below the MA-20 ($0.0740), MA-50 ($0.0858), and MA-200 ($0.1377), confirming persistent bearish momentum across all timeframes.
- Price declines 7.20% on high intraday volatility, with daily MACD, ADX, and most intraday readings signaling strong seller dominance and low probability (<20%) of a near-term rebound.
- Short-term resistance is at the Ichimoku Kijun ($0.0780), and downside risk intensifies if $0.0600 support breaks, setting a 5-day expected range of $0.0600–$0.0740.
Bearish divergence as seller momentum clashes with select bullish signals
The nearest dynamic resistance for IOTA lies around the Ichimoku Kijun level at $0.0780, while immediate support is undefined but likely near recent lows. Momentum indicators show clear bearish pressure, as both the MACD and ADX signal continued seller dominance and declining market strength. The RSI and Commodity Channel Index are positioned in neutral to mildly oversold zones, while the Stochastic RSI is strongly overbought, creating notable divergence among oscillators. Bull/Bear Power flashes a 'Strong Buy' on the daily chart, but this is contradicted by most other readings, and the Awesome Oscillator remains neutral, reinforcing an overall bias toward weakness.
Further declines likely as technical structure suppresses recovery odds
Over the next five trading days, the price is expected to move within a typical volatility band of $0.0600 – $0.0740. The probability of a price increase remains very low, below 20%, with all major timeframes and Moving Averages pointing toward further downside risk. A sideways scenario within this adjusted range is the baseline, while a bullish outlook would require a firm break and close above $0.0740 to open higher targets. Conversely, a bearish breakdown below $0.0600 could see accelerated losses toward new lows.
Previously it was reported that IOTA remains under persistent seller pressure, trading below all key moving averages and struggling to surpass resistance at the Ichimoku Kijun. Momentum and oscillator signals point to a predominantly bearish trend, with limited upside potential and risk of further declines barring a sustained move above short-term resistance.


Latest IOTA News


-
 Afghanistan
-
 Albania
-
 Algeria
-
 Angola
-
 Argentina
-
 Armenia
-
 Australia
-
 Austria
-
 Azerbaijan
-
 Bahamas
-
 Bahrain
-
 Bangladesh
-
 Belarus
-
 Belgium
-
 Bolivia
-
 Botswana
-
 Brazil
-
 Brunei
-
 Bulgaria
-
 Cambodia
-
 Cameroon
-
 Canada
-
 Chile
Chile
-
 China
China
-
 Colombia
-
 Congo
Congo
-
 Costa Rica
-
 Cote d'Ivoire
-
 Croatia
-
 Cuba
Cuba
-
 Cyprus
-
 Czechia
-
 DR Congo
-
 Denmark
-
 Dominican Republic
-
 Ecuador
-
 Egypt
Egypt
-
 El Salvador
-
 Estonia
-
 Eswatini
-
 Ethiopia
-
 Finland
-
 France
-
 Georgia
-
 Germany
-
 Ghana
Ghana
-
 Greece
-
 Haiti
Haiti
-
 Hong Kong
-
 Hungary
-
 India
India
-
 Indonesia
-
 Iran, Islamic republic
-
 Iraq
Iraq
-
 Ireland
-
 Israel
-
 Italy
Italy
-
 Jamaica
-
 Japan
Japan
-
 Jordan
-
 Kazakhstan
-
 Kenya
Kenya
-
 Korea
Korea
-
 Kuwait
-
 Kyrgyzstan
-
 Laos
Laos
-
 Latvia
-
 Lebanon
-
 Lesotho
-
 Libya
Libya
-
 Lithuania
-
 Luxembourg
-
 Madagascar
-
 Malaysia
-
 Malta
Malta
-
 Mauritius
-
 Mexico
-
 Moldova
-
 Mongolia
-
 Montenegro
-
 Morocco
-
 Mozambique
-
 Myanmar
-
 Namibia
-
 Nepal
Nepal
-
 Netherlands
-
 New Zealand
-
 Nigeria
-
 North Macedonia
-
 Norway
-
 Oman
Oman
-
 Pakistan
-
 Palestine
-
 Panama
-
 Papua New Guinea
-
 Paraguay
-
 Peru
Peru
-
 Philippines
-
 Poland
-
 Portugal
-
 Puerto Rico
-
 Qatar
Qatar
-
 Reunion
-
 Romania
-
 Rwanda
-
 Saudi Arabia
-
 Serbia
-
 Singapore
-
 Slovakia
-
 Slovenia
-
 Somalia
-
 South Africa
-
 Spain
Spain
-
 Sri Lanka
-
 Sweden
-
 Switzerland
-
 Syria
Syria
-
 Taiwan
-
 Tajikistan
-
 Tanzania
-
 Thailand
-
 Trinidad and Tobago
-
 Tunisia
-
 Turkey
-
 UAE
UAE
-
 Uganda
-
 Ukraine
-
 United Kingdom
-
United States
-
 Uruguay
-
 Uzbekistan
-
 Venezuela
-
 Vietnam
-
 Yemen
Yemen
-
 Zambia
-
 Zimbabwe
- Forex
- Crypto
