
AVAX drops 3.77% with limited buyer strength and no bullish crossover, downside risks linger – weekly review

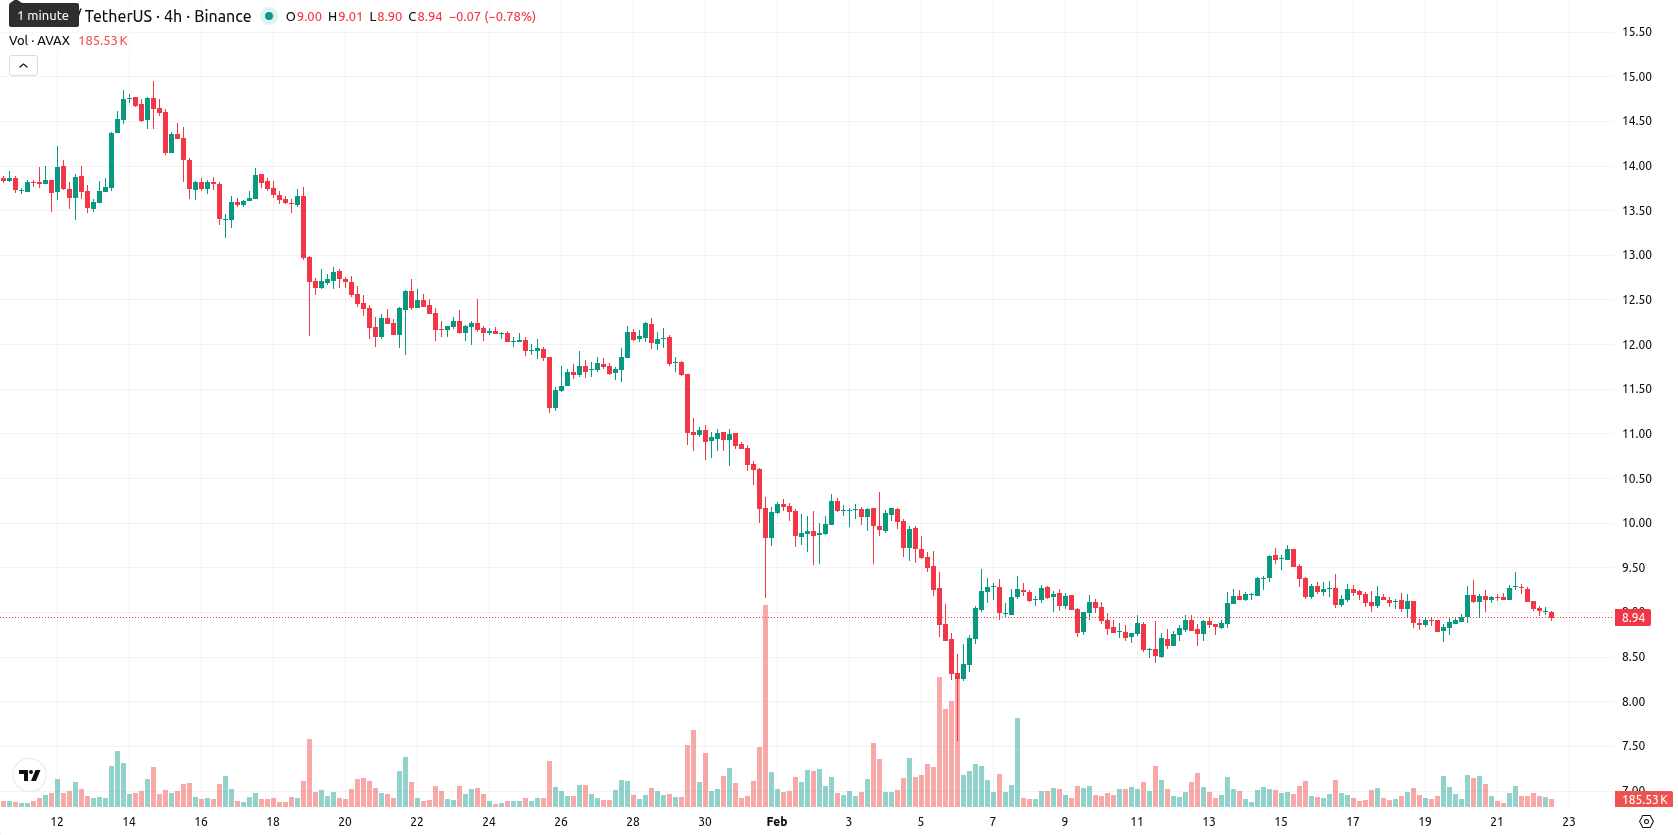
Avalanche (AVAX) is trading at $8.94, posting a weekly decline. This move leaves AVAX below its key weekly moving averages — MA-20 ($9.18), MA-50 ($11.40), and MA-200 ($18.39) — indicating continued bearish momentum across all major timeframes.
Highlights
- Avalanche (AVAX) trades at $8.94, remaining below MA-20 ($9.18), MA-50 ($11.40), and MA-200 ($18.39), reflecting sustained multi-term selling pressure.
- Daily MACD and high ADX (44.64) confirm a strong bearish trend, with RSI (39.97) and CCI (13.11) indicating weak momentum and dominant seller control.
- The critical support zone is $8.00, while resistance stands at the Ichimoku Kijun ($9.92); 5-day outlook favors consolidation with over 80% probability of further declines.
Steady trading volume as Avalanche ecosystem news fuels consolidation
Avalanche has been recognized for its scalable blockchain infrastructure and customizable network architecture. Recent developments also highlight Avalanche's positioning in supporting the expansion of on-chain prediction markets. Trading volume for AVAX increased among major altcoins during the week, with the asset maintaining steady consolidation.
Bearish signals persist as price and indicators reinforce downtrend
On the weekly timeframe, AVAX remains under the MA-20, MA-50, and MA-200, underscoring sustained downside pressure. The Ichimoku Kijun level at $9.92 serves as the nearest dynamic resistance. Weekly indicators reinforce the bearish sentiment: the RSI stands at 39.97, suggesting weak momentum, while a strong ADX reading of 44.64 confirms the current downtrend. Momentum oscillators also point to limited strength from buyers, with no golden or death cross signals observed.
Rangebound outlook with downside risk amid absence of bullish triggers
Based on weekly technicals, AVAX is likely to tread within a range of $8.00 to $9.30 over the next five to seven trading days. The probability of further price declines remains high, with a sideways consolidation scenario being most probable unless a breakout above $9.92 occurs. Should the asset breach the $8.00 level, bearish pressure could intensify. Without clear bullish confirmation, any upward moves are expected to be brief and limited.
Previously it was reported that AVAX has experienced significant price volatility, moving sharply lower over the past year amid sustained weakness in high-beta blockchain assets and waning trading volumes, while technical indicators signal ongoing cyclical pressure rather than a breakdown in core fundamentals. Last time, analysts noted that price action is consolidating near recent lows with support in the sub-$10 region, as market participants monitor developer activity and network growth for signs of reversal despite muted trend momentum.


Latest Avalanche News


-
 Afghanistan
-
 Albania
-
 Algeria
-
 Angola
-
 Argentina
-
 Armenia
-
 Australia
-
 Austria
-
 Azerbaijan
-
 Bahamas
-
 Bahrain
-
 Bangladesh
-
 Belarus
-
 Belgium
-
 Bolivia
-
 Botswana
-
 Brazil
-
 Brunei
-
 Bulgaria
-
 Cambodia
-
 Cameroon
-
 Canada
-
 Chile
Chile
-
 China
China
-
 Colombia
-
 Congo
Congo
-
 Costa Rica
-
 Cote d'Ivoire
-
 Croatia
-
 Cuba
Cuba
-
 Cyprus
-
 Czechia
-
 DR Congo
-
 Denmark
-
 Dominican Republic
-
 Ecuador
-
 Egypt
Egypt
-
 El Salvador
-
 Estonia
-
 Eswatini
-
 Ethiopia
-
 Finland
-
 France
-
 Georgia
-
 Germany
-
 Ghana
Ghana
-
 Greece
-
 Haiti
Haiti
-
 Hong Kong
-
 Hungary
-
 India
India
-
 Indonesia
-
 Iran, Islamic republic
-
 Iraq
Iraq
-
 Ireland
-
 Israel
-
 Italy
Italy
-
 Jamaica
-
 Japan
Japan
-
 Jordan
-
 Kazakhstan
-
 Kenya
Kenya
-
 Korea
Korea
-
 Kuwait
-
 Kyrgyzstan
-
 Laos
Laos
-
 Latvia
-
 Lebanon
-
 Lesotho
-
 Libya
Libya
-
 Lithuania
-
 Luxembourg
-
 Madagascar
-
 Malaysia
-
 Malta
Malta
-
 Mauritius
-
 Mexico
-
 Moldova
-
 Mongolia
-
 Montenegro
-
 Morocco
-
 Mozambique
-
 Myanmar
-
 Namibia
-
 Nepal
Nepal
-
 Netherlands
-
 New Zealand
-
 Nigeria
-
 North Macedonia
-
 Norway
-
 Oman
Oman
-
 Pakistan
-
 Palestine
-
 Panama
-
 Papua New Guinea
-
 Paraguay
-
 Peru
Peru
-
 Philippines
-
 Poland
-
 Portugal
-
 Puerto Rico
-
 Qatar
Qatar
-
 Reunion
-
 Romania
-
 Rwanda
-
 Saudi Arabia
-
 Serbia
-
 Singapore
-
 Slovakia
-
 Slovenia
-
 Somalia
-
 South Africa
-
 Spain
Spain
-
 Sri Lanka
-
 Sweden
-
 Switzerland
-
 Syria
Syria
-
 Taiwan
-
 Tajikistan
-
 Tanzania
-
 Thailand
-
 Trinidad and Tobago
-
 Tunisia
-
 Turkey
-
 UAE
UAE
-
 Uganda
-
 Ukraine
-
 United Kingdom
-
United States
-
 Uruguay
-
 Uzbekistan
-
 Venezuela
-
 Vietnam
-
 Yemen
Yemen
-
 Zambia
-
 Zimbabwe
- Forex
- Crypto
