
ALGO drops 4.03% as sellers dominate and support at $0.075 remains in focus for next week – weekly review

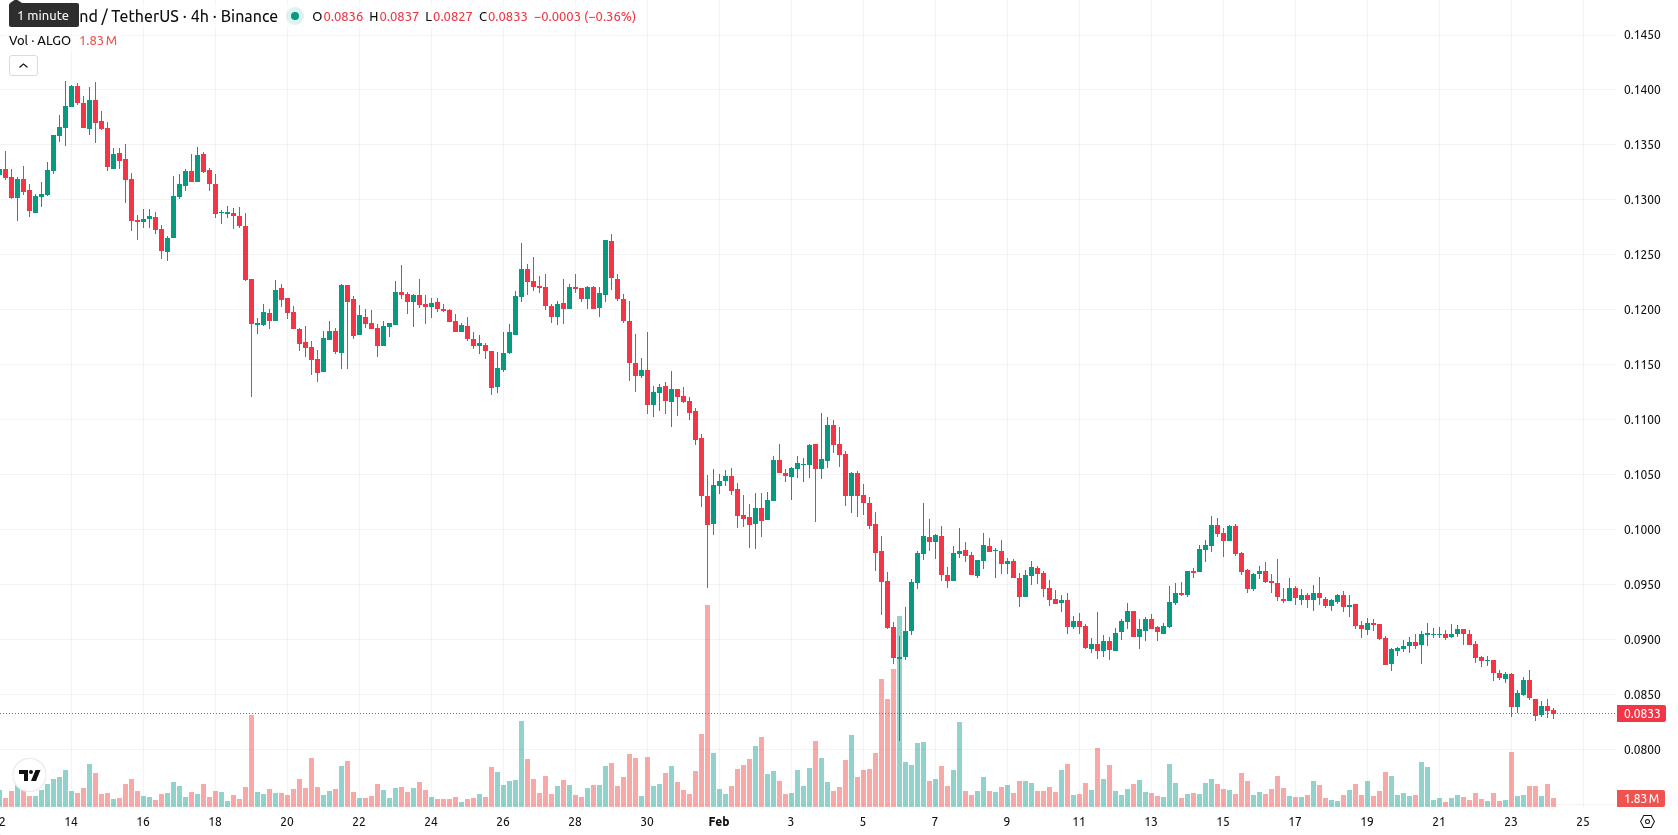
Algorand (ALGO) closed the week at $0.0833, recording a notable drop from previous levels and representing a sharp move lower by both absolute and percent terms. The price remains well below its weekly MA-20 ($0.09312), MA-50 ($0.11138), and MA-200 ($0.16850), highlighting persistent seller pressure and a clear bearish bias on the weekly chart.
Highlights
- Algorand (ALGO) trades at $0.0833, remaining well below the MA-20 ($0.09312), MA-50 ($0.11138), and MA-200 ($0.16850), confirming persistent seller pressure.
- Momentum signals are strongly negative across the board, with MACD, ADX, RSI (33), and Stochastic RSI indicating oversold conditions and a robust downtrend.
- ALGO is expected to consolidate between $0.075 and $0.090 over the next five sessions, with a sub-20% probability of price appreciation.
Critical triangle formation and low newsflow steer sentiment this week
Recent coverage has focused on Algorand's price action as it nears a critical technical point, with its native token forming a descending triangle pattern that signals price compression. Observers note that the next significant move will depend on whether ALGO breaks upper resistance or falls below support, with broader market sentiment and trading volume influencing direction. There are no reported regulatory, protocol, or ecosystem updates for Algorand this week.
Persistent oversold momentum as technicals reinforce weekly bearish stance
Weekly technical analysis continues to point to strong negative momentum for ALGO. The asset remains firmly under its major weekly moving averages with no immediate dynamic support present, while dynamic resistance aligns at the Ichimoku Kijun near $0.10380. The RSI on the weekly chart is weak at 33, signaling persistent oversold conditions, and other momentum indicators such as the MACD, Stochastic RSI, CCI, Bull/Bear Power, and the Awesome Oscillator all reinforce the strong bearish trend on the weekly timeframe.
Limited recovery prospects as near-term support and downside risks intensify
Looking ahead over the next 5 – 7 trading days, ALGO is likely to consolidate within a $0.075 – $0.090 price corridor as downside pressure remains. The probability of a sustained recovery is low, while further declines below $0.075 could accelerate losses given negative momentum and weak technical signals. Only a decisive move above $0.090 would indicate a potential shift to test higher resistance near $0.10380 on the weekly chart.
Last time, analysts noted that Algorand continues to trade firmly below all major weekly moving averages, with persistent bearish momentum and technical signals indicating potential oversold conditions. Despite some risk of a short-term rebound, downside risks remain elevated given weak support, negative momentum indicators, and dominant seller control.


-
 Afghanistan
-
 Albania
-
 Algeria
-
 Angola
-
 Argentina
-
 Armenia
-
 Australia
-
 Austria
-
 Azerbaijan
-
 Bahamas
-
 Bahrain
-
 Bangladesh
-
 Belarus
-
 Belgium
-
 Bolivia
-
 Botswana
-
 Brazil
-
 Brunei
-
 Bulgaria
-
 Cambodia
-
 Cameroon
-
 Canada
-
 Chile
Chile
-
 China
China
-
 Colombia
-
 Congo
Congo
-
 Costa Rica
-
 Cote d'Ivoire
-
 Croatia
-
 Cuba
Cuba
-
 Cyprus
-
 Czechia
-
 DR Congo
-
 Denmark
-
 Dominican Republic
-
 Ecuador
-
 Egypt
Egypt
-
 El Salvador
-
 Estonia
-
 Eswatini
-
 Ethiopia
-
 Finland
-
 France
-
 Georgia
-
 Germany
-
 Ghana
Ghana
-
 Greece
-
 Haiti
Haiti
-
 Hong Kong
-
 Hungary
-
 India
India
-
 Indonesia
-
 Iran, Islamic republic
-
 Iraq
Iraq
-
 Ireland
-
 Israel
-
 Italy
Italy
-
 Jamaica
-
 Japan
Japan
-
 Jordan
-
 Kazakhstan
-
 Kenya
Kenya
-
 Korea
Korea
-
 Kuwait
-
 Kyrgyzstan
-
 Laos
Laos
-
 Latvia
-
 Lebanon
-
 Lesotho
-
 Libya
Libya
-
 Lithuania
-
 Luxembourg
-
 Madagascar
-
 Malaysia
-
 Malta
Malta
-
 Mauritius
-
 Mexico
-
 Moldova
-
 Mongolia
-
 Montenegro
-
 Morocco
-
 Mozambique
-
 Myanmar
-
 Namibia
-
 Nepal
Nepal
-
 Netherlands
-
 New Zealand
-
 Nigeria
-
 North Macedonia
-
 Norway
-
 Oman
Oman
-
 Pakistan
-
 Palestine
-
 Panama
-
 Papua New Guinea
-
 Paraguay
-
 Peru
Peru
-
 Philippines
-
 Poland
-
 Portugal
-
 Puerto Rico
-
 Qatar
Qatar
-
 Reunion
-
 Romania
-
 Rwanda
-
 Saudi Arabia
-
 Serbia
-
 Singapore
-
 Slovakia
-
 Slovenia
-
 Somalia
-
 South Africa
-
 Spain
Spain
-
 Sri Lanka
-
 Sweden
-
 Switzerland
-
 Syria
Syria
-
 Taiwan
-
 Tajikistan
-
 Tanzania
-
 Thailand
-
 Trinidad and Tobago
-
 Tunisia
-
 Turkey
-
 UAE
UAE
-
 Uganda
-
 Ukraine
-
 United Kingdom
-
United States
-
 Uruguay
-
 Uzbekistan
-
 Venezuela
-
 Vietnam
-
 Yemen
Yemen
-
 Zambia
-
 Zimbabwe
- Forex
- Crypto
