
Solana price prediction: Will resistance cap rally? SOL climbs 7.30% near $88

Solana (SOL) is trading at $88.30, which is above the MA-20 ($84.08) but remains well below both the MA-50 ($109.01) and MA-200 ($158.95). This setup signals short-term bullishness recovering from recent lows, but medium- and long-term trends continue to face resistance from persistent seller pressure. The Ichimoku Kijun is at $93.18, standing above the current price and therefore acting as immediate resistance.
SOL price prediction
Current price:
$ 69.04
-1.05
1.50%
Real-time Data
05:41
Daily range
67.49
 69.07
69.07
Weekly range
64.71
75.00
Loading...
Highlights
- Institutional demand for Solana strengthened after spot Solana ETFs recorded net inflows of approximately 391,540 SOL on February 25.
- Open interest in SOL futures expanded over 5% to $5.27 billion, while top DEX trading volumes and about $640,000 in daily fees underscore robust network activity, despite project shutdowns following a $28.9 million hack.
- SOL trades at $88.30, above its MA-20 but below MA-50 and MA-200, with immediate resistance at $93.18 and strengthening bearish momentum pointing to a likely consolidation or downside scenario.
Institutional inflows rise as project hacks trigger targeted buybacks
Institutional demand for Solana has strengthened, as spot Solana ETFs recorded net inflows of approximately 391,540 SOL on February 25. Open interest in SOL futures grew more than 5% to $5.27 billion as the asset maintained strong daily fee generation, collecting about $640,000 in the past 24 hours and holding the highest DEX trading volume among layer 1 blockchains over the last week. Several Solana-based projects, including Step Finance, SolanaFloor, and Remora Markets, announced immediate shutdowns following a $28.9 million hack, with buybacks planned for affected holders.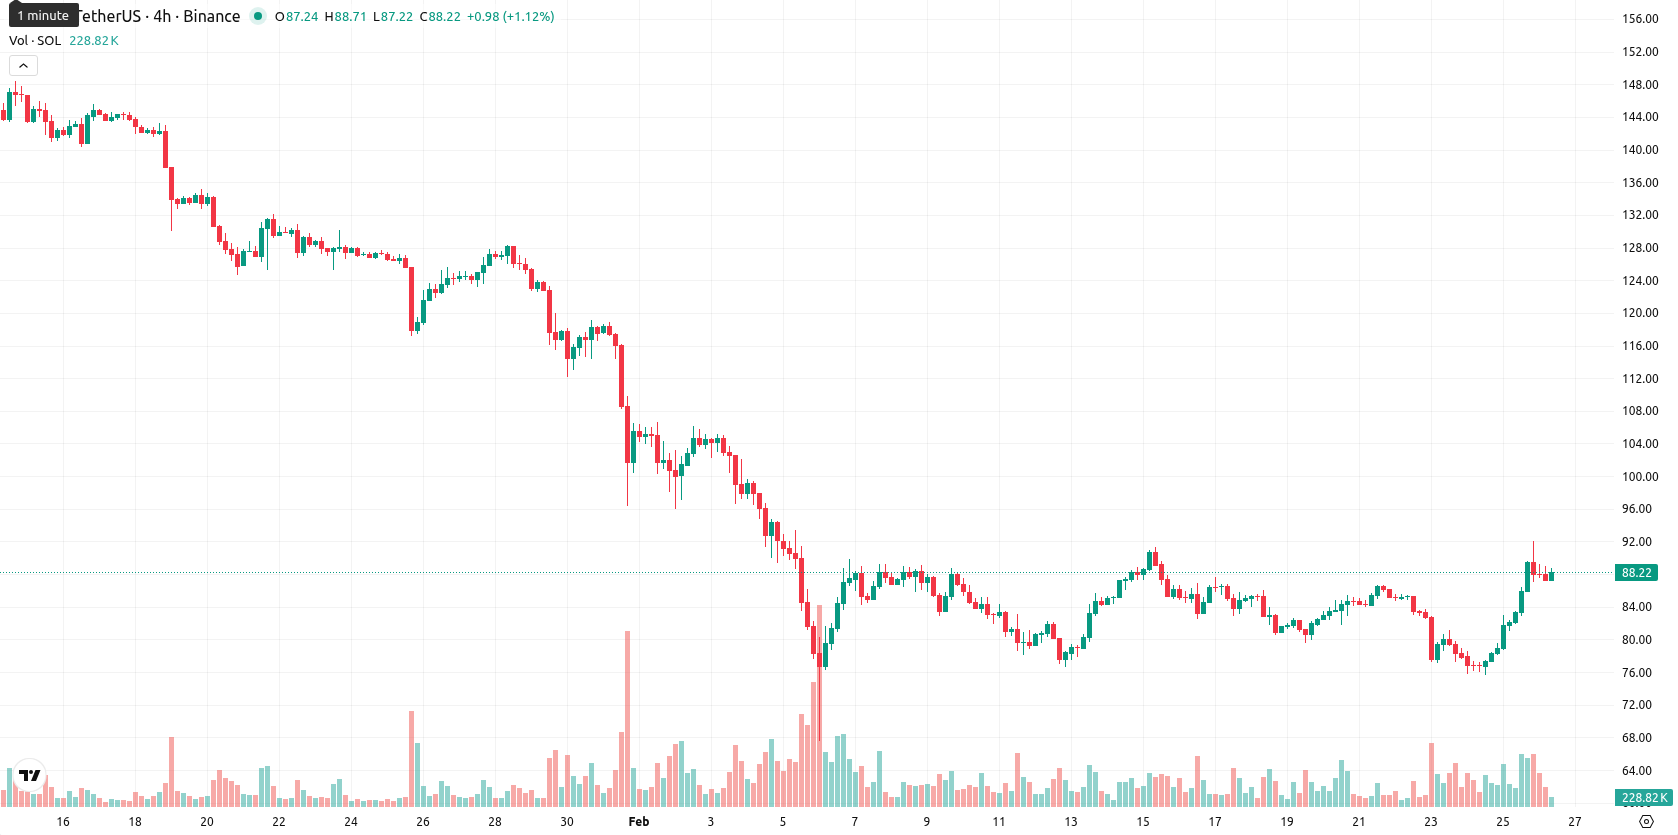
Seller momentum persists despite intraday rally and indicator divergence
Momentum signals show notable divergence: the MACD and ADX on the daily chart both indicate persisting bearish momentum despite the surge, while the RSI points to sell conditions and the Stochastic RSI is strongly overbought. The Bull/Bear Power indicator reads as overbought with notable buyer dominance intraday, yet the Awesome Oscillator remains neutral and does not confirm new trend strength. Today’s session began with a significant gap up from the previous close ($82.29), and the price is trading near the upper end of the daily range with high volatility and pronounced strength toward the highs, but this intraday rebound is contradicted by weak daily momentum.Downside risk elevated as consolidation expected within volatility corridor
For the next five trading days, the expected normalized price corridor is $81.00 to $93.00. There is a very low probability (less than 20%) of further price increases, making a downside scenario more likely. The baseline scenario is consolidation within this volatility band as market inertia dominates. A bullish scenario would require a firm break above the immediate resistance at $93.18, opening space for a recovery, while a bearish scenario sees price faltering back below $81.00 as sellers regain control. Persistent weakness in weekly momentum signals and medium-term Moving Averages suggest the risk of renewed downside remains elevated.
Anton Kharitonov, expert at Traders Union, sees Solana gaining short-term strength but struggling to reverse its overall bearish momentum. He notes that institutional flows remain robust, yet technical resistance and momentum divergence keep risk skewed to the downside. Kharitonov believes price action is dominated by seller pressure despite recent demand and fee generation. "Until Solana clearly reclaims resistance at $93.18, the downside remains my base case in the current environment."
Previously it was reported that Solana is experiencing a brief rebound above its short-term moving average, though the asset remains well below its medium- and long-term averages, signaling continued downward pressure from longer-term holders. While some intraday oscillators indicate emerging oversold conditions, core momentum indicators such as MACD and ADX continue to show strong bearish signals, and the nearest resistance remains at the Ichimoku Kijun, with no major support directly below.
Source of Data:
SOL Price Analysis by TU
The analysis is based on a proprietary model combining technical, on-chain, and expert data. Not investment advice. See
methodology
The information is based on forecasts and does not constitute investment advice or a guarantee of future results. Market conditions may change. See our Disclaimer and Editorial Integrity for details.
Subscribe to TU news

Did you like the article?


Latest Solana News


Weekly Top Bonuses

Top News


Top 5 companies for you

United States
-
 Afghanistan
-
 Albania
-
 Algeria
-
 Angola
-
 Argentina
-
 Armenia
-
 Australia
-
 Austria
-
 Azerbaijan
-
 Bahamas
-
 Bahrain
-
 Bangladesh
-
 Belarus
-
 Belgium
-
 Bolivia
-
 Botswana
-
 Brazil
-
 Brunei
-
 Bulgaria
-
 Cambodia
-
 Cameroon
-
 Canada
-
 Chile
Chile
-
 China
China
-
 Colombia
-
 Congo
Congo
-
 Costa Rica
-
 Cote d'Ivoire
-
 Croatia
-
 Cuba
Cuba
-
 Cyprus
-
 Czechia
-
 DR Congo
-
 Denmark
-
 Dominican Republic
-
 Ecuador
-
 Egypt
Egypt
-
 El Salvador
-
 Estonia
-
 Eswatini
-
 Ethiopia
-
 Finland
-
 France
-
 Georgia
-
 Germany
-
 Ghana
Ghana
-
 Greece
-
 Haiti
Haiti
-
 Hong Kong
-
 Hungary
-
 India
India
-
 Indonesia
-
 Iran, Islamic republic
-
 Iraq
Iraq
-
 Ireland
-
 Israel
-
 Italy
Italy
-
 Jamaica
-
 Japan
Japan
-
 Jordan
-
 Kazakhstan
-
 Kenya
Kenya
-
 Korea
Korea
-
 Kuwait
-
 Kyrgyzstan
-
 Laos
Laos
-
 Latvia
-
 Lebanon
-
 Lesotho
-
 Libya
Libya
-
 Lithuania
-
 Luxembourg
-
 Madagascar
-
 Malaysia
-
 Malta
Malta
-
 Mauritius
-
 Mexico
-
 Moldova
-
 Mongolia
-
 Montenegro
-
 Morocco
-
 Mozambique
-
 Myanmar
-
 Namibia
-
 Nepal
Nepal
-
 Netherlands
-
 New Zealand
-
 Nigeria
-
 North Macedonia
-
 Norway
-
 Oman
Oman
-
 Pakistan
-
 Palestine
-
 Panama
-
 Papua New Guinea
-
 Paraguay
-
 Peru
Peru
-
 Philippines
-
 Poland
-
 Portugal
-
 Puerto Rico
-
 Qatar
Qatar
-
 Reunion
-
 Romania
-
 Rwanda
-
 Saudi Arabia
-
 Serbia
-
 Singapore
-
 Slovakia
-
 Slovenia
-
 Somalia
-
 South Africa
-
 Spain
Spain
-
 Sri Lanka
-
 Sweden
-
 Switzerland
-
 Syria
Syria
-
 Taiwan
-
 Tajikistan
-
 Tanzania
-
 Thailand
-
 Trinidad and Tobago
-
 Tunisia
-
 Turkey
-
 UAE
UAE
-
 Uganda
-
 Ukraine
-
 United Kingdom
-
United States
-
 Uruguay
-
 Uzbekistan
-
 Venezuela
-
 Vietnam
-
 Yemen
Yemen
-
 Zambia
-
 Zimbabwe
- Forex
- Crypto
Live News
