
Sui: Fresh ETF activity sparks a 7.13% rally despite long-term downtrend

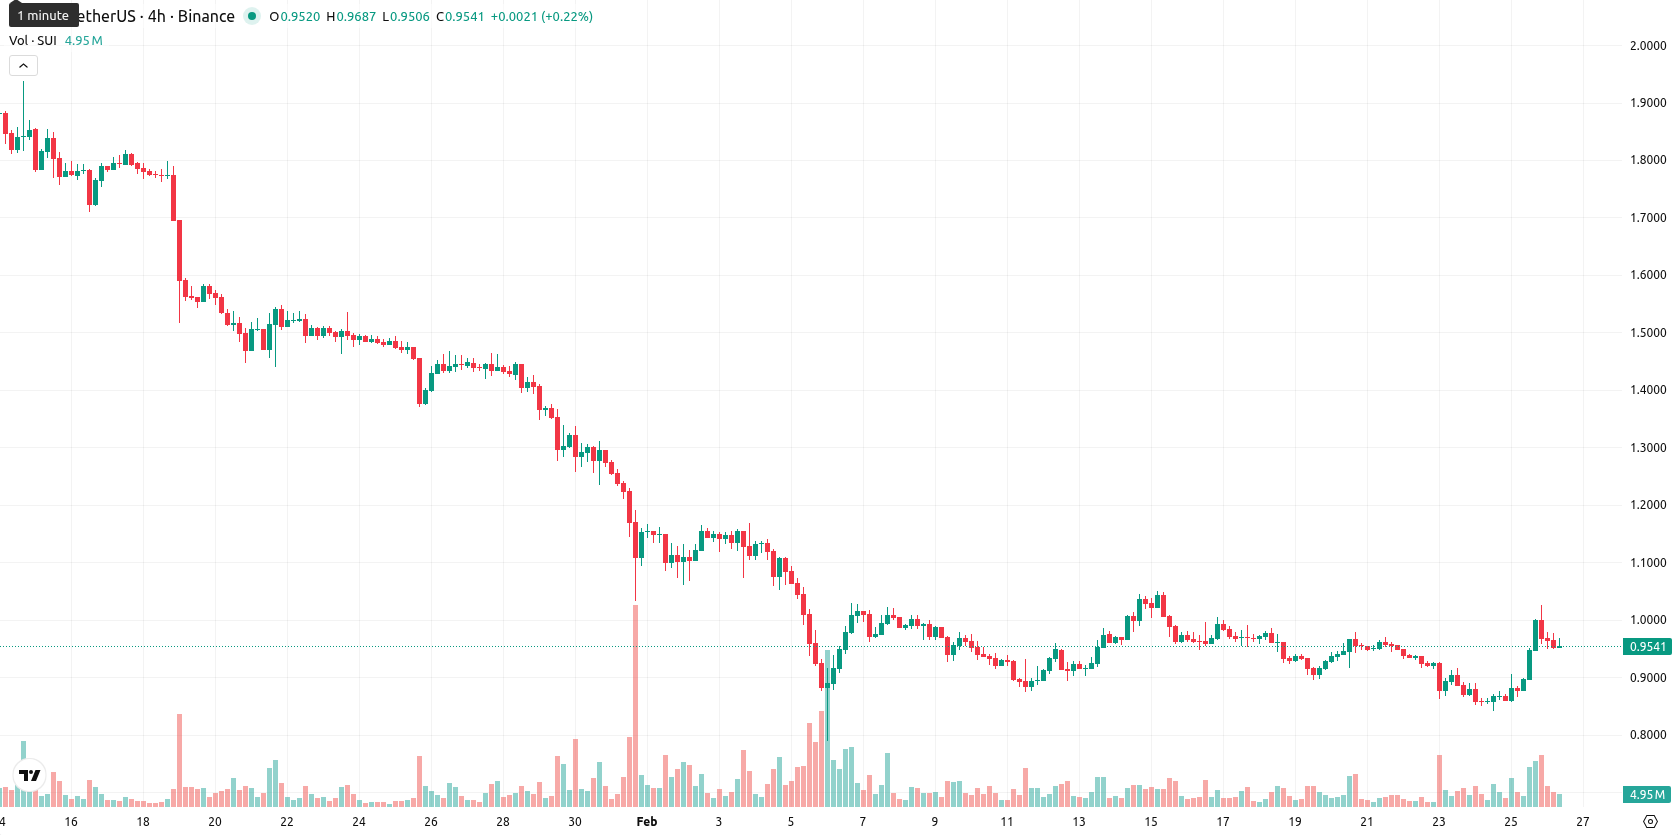
Sui (SUI) is trading at $0.9554, showing a 7.13% gain on the day and moving just above the MA-20 at $0.9516, though it remains well below the MA-50 ($1.2882) and MA-200 ($2.2306), indicating short-term buyer momentum within a broader medium- and long-term downtrend.
Highlights
- 21Shares launched the Spot SUI ETF (TSUI) on Nasdaq on February 24, 2026, following SEC approval, providing U.S. investors regulated access to Sui for the first time.
- Multiple Sui-focused ETFs, including Canary Staked SUI ETF and Grayscale Sui Staking ETF, debuted on Nasdaq the same day, signaling heightened institutional interest in the Sui blockchain ecosystem.
- SUI is trading at $0.9554, with immediate resistance at $1.0334 (Ichimoku Kijun), medium-term trend remaining bearish and downside risk toward $0.85.
ETF launches boost Sui's institutional access after SEC approval
On February 24, 2026, 21Shares launched the Spot SUI ETF (TSUI) on Nasdaq following SEC approval, enabling U.S. investors to access Sui through regulated channels for the first time. Several other Sui-focused ETFs, including the Canary Staked SUI ETF and the Grayscale Sui Staking ETF, also debuted on Nasdaq the same day. This cluster of ETF launches highlights rising institutional attention and confidence in the Sui blockchain ecosystem.
Persistent downtrend holds as mixed momentum follows early price gap
Technically, SUI is trading just above its MA-20 ($0.9516) but remains under pressure from the MA-50 ($1.2882) and MA-200 ($2.2306), underscoring a persistent medium- to long-term downtrend, while the Ichimoku Kijun at $1.0334 serves as immediate resistance. Momentum indicators are mixed: the MACD signals a strong sell, ADX at 45 highlights a robust trend, the RSI at 44.40 identifies a lack of bullish momentum, Stochastic RSI is overbought at 100, and CCI is neutral. Bull/Bear Power is strongly positive, suggesting intraday buyer strength, while the Awesome Oscillator is neutral. SUI remains volatile after an early gap up, trading near the lower end of today’s $0.9502–$0.9768 range and showing some profit-taking.
Downside risk grows with low odds of breakout in coming sessions
For the next five sessions, the typical volatility band for SUI is expected between $0.85 and $1.07. The chances of a further move higher are low (under 20%), making a downward move more probable. Baseline scenario: SUI trades sideways in the $0.90 to $1.00 range as buyers and sellers find equilibrium. Upside scenario: a break above $1.03 could target $1.07, while renewed selling below $0.90 would increase the risk of a pullback toward $0.85.
Previously it was reported that Sui (SUI) is staging a short-term rebound above its 20-day moving average, though it continues to trade below both medium- and long-term moving averages, signaling ongoing broader downtrend pressure despite recent institutional inflows and heightened volatility. Momentum indicators such as MACD and ADX remain bearish, RSI sits below 50, and resistance is positioned near the Ichimoku Kijun level, highlighting persistent seller dominance and a lack of clear reversal signals.


-
 Afghanistan
-
 Albania
-
 Algeria
-
 Angola
-
 Argentina
-
 Armenia
-
 Australia
-
 Austria
-
 Azerbaijan
-
 Bahamas
-
 Bahrain
-
 Bangladesh
-
 Belarus
-
 Belgium
-
 Bolivia
-
 Botswana
-
 Brazil
-
 Brunei
-
 Bulgaria
-
 Cambodia
-
 Cameroon
-
 Canada
-
 Chile
Chile
-
 China
China
-
 Colombia
-
 Congo
Congo
-
 Costa Rica
-
 Cote d'Ivoire
-
 Croatia
-
 Cuba
Cuba
-
 Cyprus
-
 Czechia
-
 DR Congo
-
 Denmark
-
 Dominican Republic
-
 Ecuador
-
 Egypt
Egypt
-
 El Salvador
-
 Estonia
-
 Eswatini
-
 Ethiopia
-
 Finland
-
 France
-
 Georgia
-
 Germany
-
 Ghana
Ghana
-
 Greece
-
 Haiti
Haiti
-
 Hong Kong
-
 Hungary
-
 India
India
-
 Indonesia
-
 Iran, Islamic republic
-
 Iraq
Iraq
-
 Ireland
-
 Israel
-
 Italy
Italy
-
 Jamaica
-
 Japan
Japan
-
 Jordan
-
 Kazakhstan
-
 Kenya
Kenya
-
 Korea
Korea
-
 Kuwait
-
 Kyrgyzstan
-
 Laos
Laos
-
 Latvia
-
 Lebanon
-
 Lesotho
-
 Libya
Libya
-
 Lithuania
-
 Luxembourg
-
 Madagascar
-
 Malaysia
-
 Malta
Malta
-
 Mauritius
-
 Mexico
-
 Moldova
-
 Mongolia
-
 Montenegro
-
 Morocco
-
 Mozambique
-
 Myanmar
-
 Namibia
-
 Nepal
Nepal
-
 Netherlands
-
 New Zealand
-
 Nigeria
-
 North Macedonia
-
 Norway
-
 Oman
Oman
-
 Pakistan
-
 Palestine
-
 Panama
-
 Papua New Guinea
-
 Paraguay
-
 Peru
Peru
-
 Philippines
-
 Poland
-
 Portugal
-
 Puerto Rico
-
 Qatar
Qatar
-
 Reunion
-
 Romania
-
 Rwanda
-
 Saudi Arabia
-
 Serbia
-
 Singapore
-
 Slovakia
-
 Slovenia
-
 Somalia
-
 South Africa
-
 Spain
Spain
-
 Sri Lanka
-
 Sweden
-
 Switzerland
-
 Syria
Syria
-
 Taiwan
-
 Tajikistan
-
 Tanzania
-
 Thailand
-
 Trinidad and Tobago
-
 Tunisia
-
 Turkey
-
 UAE
UAE
-
 Uganda
-
 Ukraine
-
 United Kingdom
-
United States
-
 Uruguay
-
 Uzbekistan
-
 Venezuela
-
 Vietnam
-
 Yemen
Yemen
-
 Zambia
-
 Zimbabwe
- Forex
- Crypto
