
Solana climbs 4.35% as institutional interest revives after ETF inflows

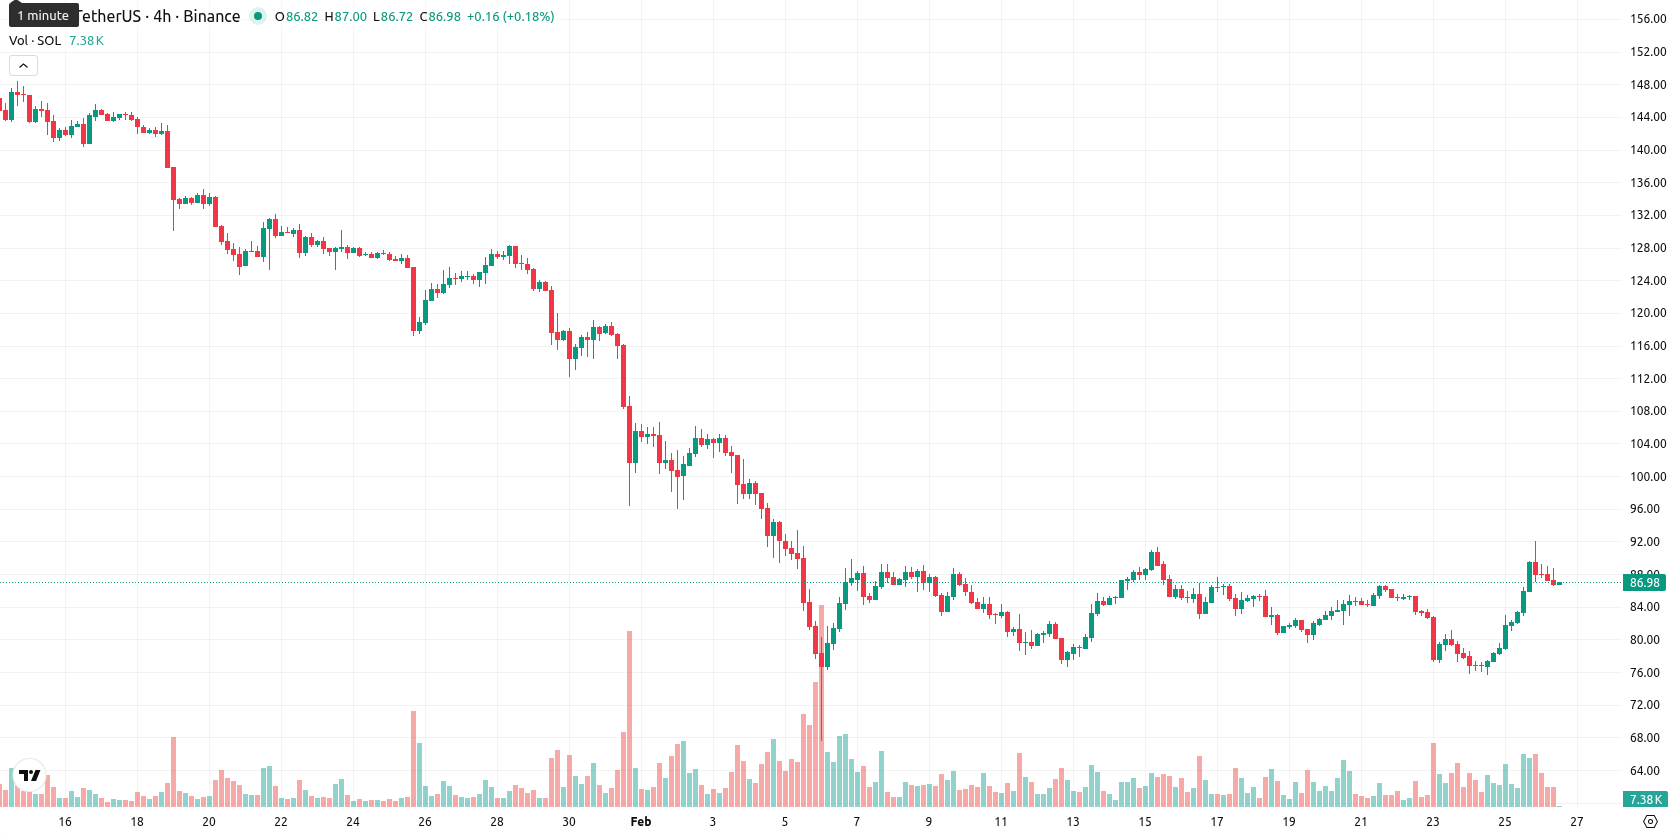
Solana (SOL) is trading at $86.90, up 4.35% on the day. The asset sits above the MA-20 of $84.08 but remains well below the MA-50 at $109.01 and MA-200 at $158.95, suggesting persistent medium- and long-term downward pressure, despite a short-term upward bias.
Highlights
- U.S. spot Solana ETFs attracted $3.78 million in net inflows on February 24, evidencing renewed institutional demand and greater regulatory oversight exposure.
- Regulatory discussions regarding interest payments on stablecoins raise risks for DeFi on Solana, potentially affecting stablecoin liquidity and usage under future U.S. policy shifts.
- SOL trades at $86.90 with short-term upward bias, but faces immediate resistance at $93.18 and increased downside risk if dropping below $78.00.
Institutional inflows rise as regulatory debate intensifies
On February 24, U.S. spot Solana ETFs recorded around $3.78 million in net inflows, highlighting renewed institutional interest from regulated market participants. This increased participation demonstrates Solana’s growing exposure to U.S. regulatory oversight, which could impact accessibility and demand depending on future legislative or SEC actions related to digital asset investment vehicles. Additionally, ongoing discussions regarding interest payments on stablecoins point to regulatory risks for DeFi activities on Solana, as potential law or policy shifts might affect stablecoin-based liquidity and usage. Broader macroeconomic policy measures, such as U.S. Federal Reserve interest rate decisions and trade tariffs, continue to exert indirect pressure on Solana’s global liquidity and overall digital asset demand.
Upward attempts fade as momentum signals split and volatility spikes
SOL is currently trading at $86.90, above both the MA-20 ($84.08) and well below the MA-50 ($109.01) and MA-200 ($158.95). This positioning points to a short-term upward bias but indicates continued medium- and long-term downward pressure from sellers. The Ichimoku Kijun is at $93.18, which sits above the current price, serving as immediate resistance. Momentum indicators on the daily chart remain mixed. The MACD signals a strong sell while the ADX reflects elevated bearish strength, yet the Commodity Channel Index shows a buy and the Stochastic RSI and Bull/Bear Power both highlight overbought conditions, suggesting buyers temporarily dominate. Daily price action is positive, with the price up $3.62 or 4.35% and opening notably higher than the prior close, reflecting a gap up. SOL currently trades near the lower end of today’s range ($86.76–$89.23), confirming high intraday volatility and some pressure after the open. Oscillator signals are notably divergent, indicating short-term upward attempts may be capped by fading momentum.
Limited upside likely as bearish trend caps short-term moves
For the next five sessions, price action in SOL is likely to fluctuate within a volatility band relative to current levels, between $78.00 and $95.00 based on typical volatility and the current price structure. A sustained move higher is considered unlikely, with less than a 20% probability, as major weekly trend and momentum signals remain bearish. The most probable scenario is sideways movement within this corridor. If SOL breaks above immediate resistance at $93.18, it could retest the upper bound, while a drop below $78.00 would increase downside momentum and open the door to further selling pressure.
Previously it was reported that Solana is experiencing a short-term rebound, trading above its 20-day moving average but remaining under medium- and long-term moving averages, with immediate resistance at the Ichimoku Kijun. Momentum indicators including MACD and ADX continue to show prevailing bearish conditions despite intraday buying, while overbought oscillator readings and persistent seller pressure suggest elevated downside risk without a confirmed trend reversal.


Latest Solana News


-
 Afghanistan
-
 Albania
-
 Algeria
-
 Angola
-
 Argentina
-
 Armenia
-
 Australia
-
 Austria
-
 Azerbaijan
-
 Bahamas
-
 Bahrain
-
 Bangladesh
-
 Belarus
-
 Belgium
-
 Bolivia
-
 Botswana
-
 Brazil
-
 Brunei
-
 Bulgaria
-
 Cambodia
-
 Cameroon
-
 Canada
-
 Chile
Chile
-
 China
China
-
 Colombia
-
 Congo
Congo
-
 Costa Rica
-
 Cote d'Ivoire
-
 Croatia
-
 Cuba
Cuba
-
 Cyprus
-
 Czechia
-
 DR Congo
-
 Denmark
-
 Dominican Republic
-
 Ecuador
-
 Egypt
Egypt
-
 El Salvador
-
 Estonia
-
 Eswatini
-
 Ethiopia
-
 Finland
-
 France
-
 Georgia
-
 Germany
-
 Ghana
Ghana
-
 Greece
-
 Haiti
Haiti
-
 Hong Kong
-
 Hungary
-
 India
India
-
 Indonesia
-
 Iran, Islamic republic
-
 Iraq
Iraq
-
 Ireland
-
 Israel
-
 Italy
Italy
-
 Jamaica
-
 Japan
Japan
-
 Jordan
-
 Kazakhstan
-
 Kenya
Kenya
-
 Korea
Korea
-
 Kuwait
-
 Kyrgyzstan
-
 Laos
Laos
-
 Latvia
-
 Lebanon
-
 Lesotho
-
 Libya
Libya
-
 Lithuania
-
 Luxembourg
-
 Madagascar
-
 Malaysia
-
 Malta
Malta
-
 Mauritius
-
 Mexico
-
 Moldova
-
 Mongolia
-
 Montenegro
-
 Morocco
-
 Mozambique
-
 Myanmar
-
 Namibia
-
 Nepal
Nepal
-
 Netherlands
-
 New Zealand
-
 Nigeria
-
 North Macedonia
-
 Norway
-
 Oman
Oman
-
 Pakistan
-
 Palestine
-
 Panama
-
 Papua New Guinea
-
 Paraguay
-
 Peru
Peru
-
 Philippines
-
 Poland
-
 Portugal
-
 Puerto Rico
-
 Qatar
Qatar
-
 Reunion
-
 Romania
-
 Rwanda
-
 Saudi Arabia
-
 Serbia
-
 Singapore
-
 Slovakia
-
 Slovenia
-
 Somalia
-
 South Africa
-
 Spain
Spain
-
 Sri Lanka
-
 Sweden
-
 Switzerland
-
 Syria
Syria
-
 Taiwan
-
 Tajikistan
-
 Tanzania
-
 Thailand
-
 Trinidad and Tobago
-
 Tunisia
-
 Turkey
-
 UAE
UAE
-
 Uganda
-
 Ukraine
-
 United Kingdom
-
United States
-
 Uruguay
-
 Uzbekistan
-
 Venezuela
-
 Vietnam
-
 Yemen
Yemen
-
 Zambia
-
 Zimbabwe
- Forex
- Crypto
