
Solana price prediction: Broad selling pressure holds gains in check? SOL consolidates near $87

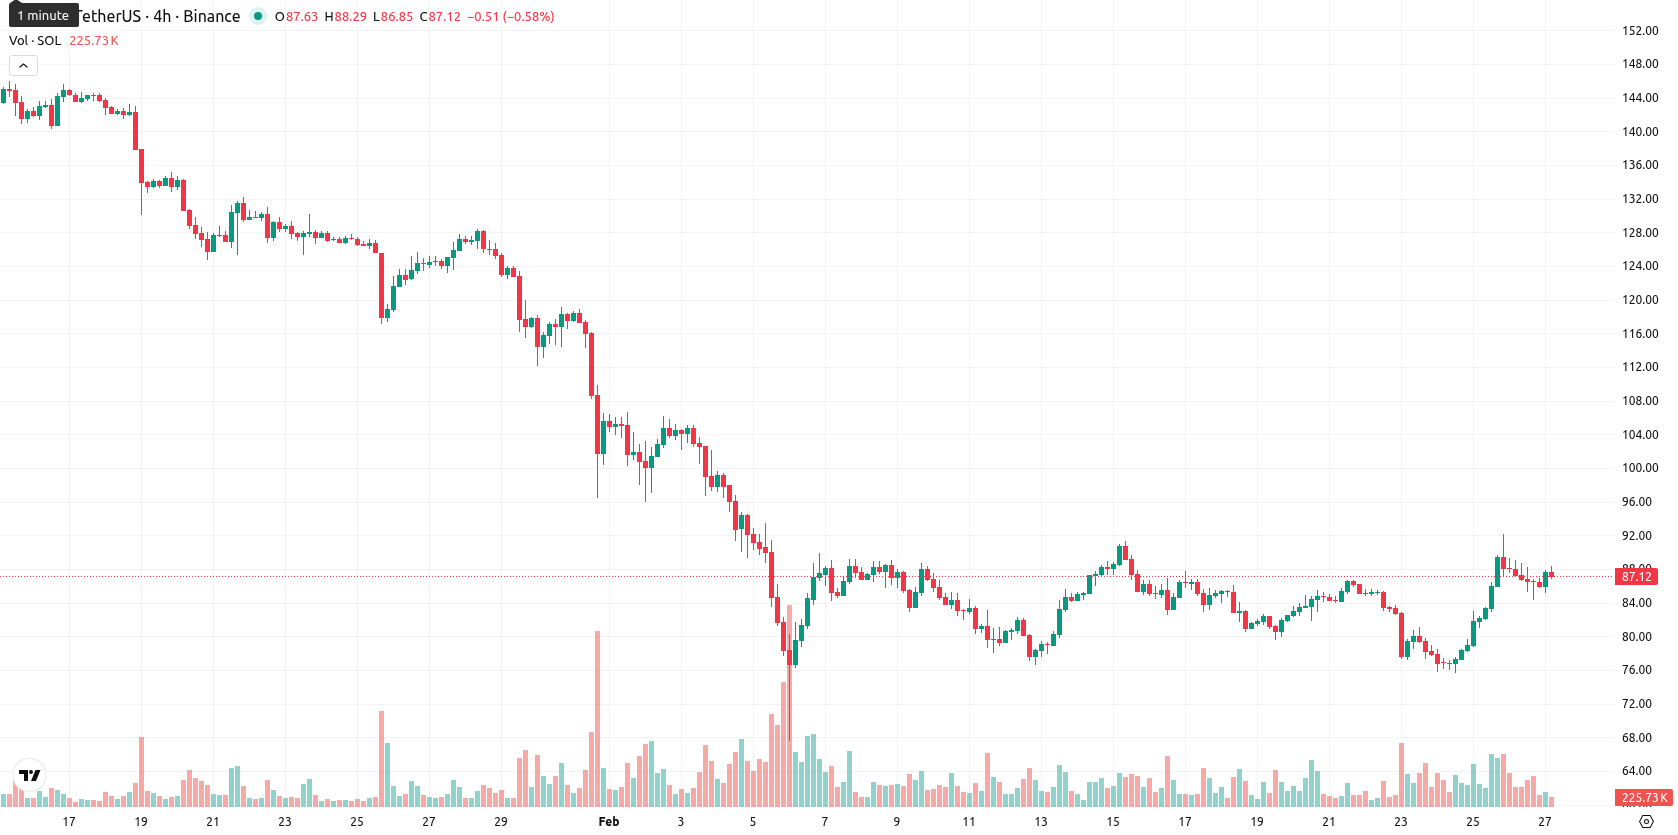
Solana (SOL) is trading at $87, down 0.99% for the day. The asset is positioned above its MA-20 ($83.99), but remains well below the MA-50 ($107.99) and MA-200 ($158.47), indicating a constructive short-term structure but ongoing medium- and long-term selling pressure. Immediate resistance is found at the Ichimoku Kijun ($87.10).
Highlights
- US spot Solana ETFs saw a $30.86 million inflow on Wednesday, the largest in over two months, marking eleven consecutive days of net positive flows.
- Derivatives data show Solana futures open interest rose 7% and funding rates turned positive, but a transfer of 3.9 million SOL to exchanges signals potential selling pressure.
- Solana trades at $87, near the Ichimoku Kijun resistance at $87.10, with technicals suggesting likely sideways movement between $78 and $95 amid bearish momentum.
ETF inflows and exchange transfers as sentiment remains cautious
On Wednesday, a $30.86 million inflow was recorded into US spot Solana ETFs, marking the largest single-day inflow in over two months and making it eleven consecutive days of positive net flows. Derivatives data indicated a 7% increase in Solana futures open interest and a shift of the funding rate into positive territory, while nearly 3.9 million SOL were transferred to exchanges, reflecting potential selling activity. Solana's network infrastructure efforts also continued, with the DoubleZero team working to distribute geographic concentration and improve network resilience, though price action has remained under broader selling pressure.
Mixed oscillator signals as consolidation and downside risk build
Momentum signals on the daily timeframe reflect persistent but mixed seller pressure for SOL. The MACD and ADX both indicate a strong bearish environment, while the RSI is in neutral territory. Stochastic RSI and Bull/Bear Power both highlight overbought conditions — a potential sign of buyer exhaustion — though CCI points to modest buy momentum. Bull/Bear Power currently suggests buyers are dominant, but with the price near the middle of today’s range ($85.23 – $88.25) and a daily decline of 0.99% amid moderate volatility and consolidation, downside risk remains as intraday action has not confirmed a decisive rebound.
Sideways movement likely as bearish momentum limits upside
In the near term, the expected trading range for the next five days is $78.00 – $95.00, based on typical volatility bands around current levels. The probability of a price increase is assessed at less than 20%, with further declines more likely due to trend structure and bearish readings from the weekly MACD, RSI, and moving averages. Baseline expectation is continued sideways movement between $78 and $95. A bullish scenario would require a sustained break above immediate resistance at $87.10, targeting $95, while a bearish scenario could emerge if $85 support is lost, potentially exposing levels near $78.
Last time, analysts noted that Solana was showing a short-term upward bias above its 20-day moving average but remained under persistent medium- and long-term downward pressure, with immediate resistance at the Ichimoku Kijun. While daily momentum indicators such as MACD and ADX reflected prevailing bearish conditions, mixed oscillator signals and overbought readings suggested that any upward moves could be short-lived amid ongoing volatility and limited upside potential.


Latest Solana News


-
 Afghanistan
-
 Albania
-
 Algeria
-
 Angola
-
 Argentina
-
 Armenia
-
 Australia
-
 Austria
-
 Azerbaijan
-
 Bahamas
-
 Bahrain
-
 Bangladesh
-
 Belarus
-
 Belgium
-
 Bolivia
-
 Botswana
-
 Brazil
-
 Brunei
-
 Bulgaria
-
 Cambodia
-
 Cameroon
-
 Canada
-
 Chile
Chile
-
 China
China
-
 Colombia
-
 Congo
Congo
-
 Costa Rica
-
 Cote d'Ivoire
-
 Croatia
-
 Cuba
Cuba
-
 Cyprus
-
 Czechia
-
 DR Congo
-
 Denmark
-
 Dominican Republic
-
 Ecuador
-
 Egypt
Egypt
-
 El Salvador
-
 Estonia
-
 Eswatini
-
 Ethiopia
-
 Finland
-
 France
-
 Georgia
-
 Germany
-
 Ghana
Ghana
-
 Greece
-
 Haiti
Haiti
-
 Hong Kong
-
 Hungary
-
 India
India
-
 Indonesia
-
 Iran, Islamic republic
-
 Iraq
Iraq
-
 Ireland
-
 Israel
-
 Italy
Italy
-
 Jamaica
-
 Japan
Japan
-
 Jordan
-
 Kazakhstan
-
 Kenya
Kenya
-
 Korea
Korea
-
 Kuwait
-
 Kyrgyzstan
-
 Laos
Laos
-
 Latvia
-
 Lebanon
-
 Lesotho
-
 Libya
Libya
-
 Lithuania
-
 Luxembourg
-
 Madagascar
-
 Malaysia
-
 Malta
Malta
-
 Mauritius
-
 Mexico
-
 Moldova
-
 Mongolia
-
 Montenegro
-
 Morocco
-
 Mozambique
-
 Myanmar
-
 Namibia
-
 Nepal
Nepal
-
 Netherlands
-
 New Zealand
-
 Nigeria
-
 North Macedonia
-
 Norway
-
 Oman
Oman
-
 Pakistan
-
 Palestine
-
 Panama
-
 Papua New Guinea
-
 Paraguay
-
 Peru
Peru
-
 Philippines
-
 Poland
-
 Portugal
-
 Puerto Rico
-
 Qatar
Qatar
-
 Reunion
-
 Romania
-
 Rwanda
-
 Saudi Arabia
-
 Serbia
-
 Singapore
-
 Slovakia
-
 Slovenia
-
 Somalia
-
 South Africa
-
 Spain
Spain
-
 Sri Lanka
-
 Sweden
-
 Switzerland
-
 Syria
Syria
-
 Taiwan
-
 Tajikistan
-
 Tanzania
-
 Thailand
-
 Trinidad and Tobago
-
 Tunisia
-
 Turkey
-
 UAE
UAE
-
 Uganda
-
 Ukraine
-
 United Kingdom
-
United States
-
 Uruguay
-
 Uzbekistan
-
 Venezuela
-
 Vietnam
-
 Yemen
Yemen
-
 Zambia
-
 Zimbabwe
- Forex
- Crypto
