

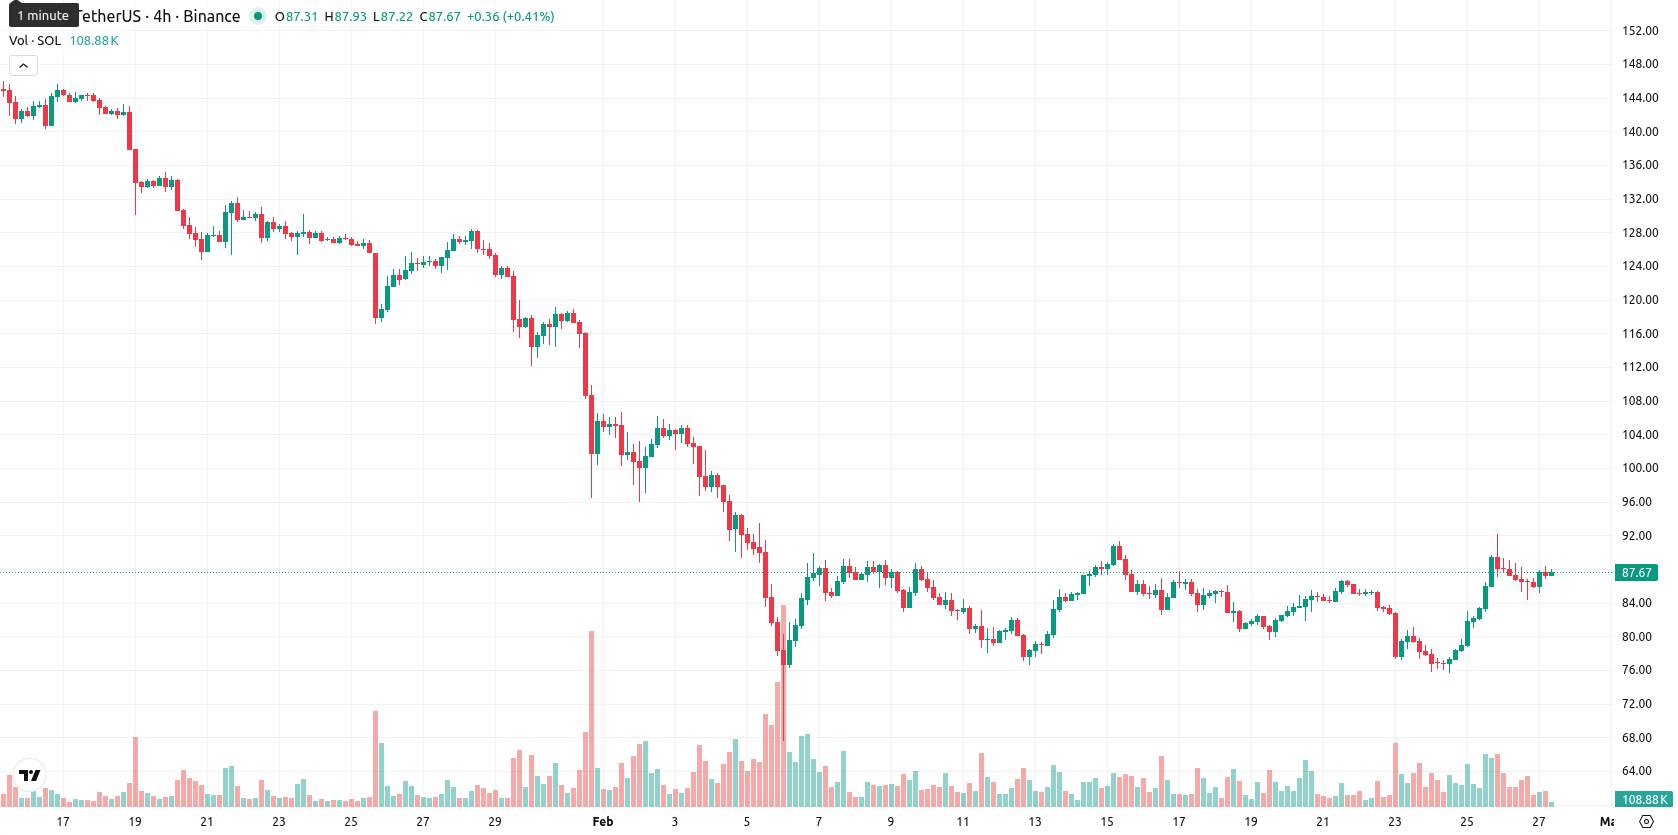
Solana (SOL) is trading at $87.57, which is above the MA-20 ($83.99) but well below both the MA-50 ($107.99) and MA-200 ($158.47). This reflects short-term strength while medium- and long-term trends continue to indicate bearish pressure.
Highlights
- Nasdaq filed a 19b-4 form with the SEC seeking approval for the VanEck JitoSOL ETF, aiming to introduce regulated Solana liquid staking to U.S. investors.
- SEC approval delays or denials could restrict institutional access, contrasting with recent regulatory progress in Europe such as 21Shares' Jito-staked Solana launch in January.
- Solana trades at $87.57, sustained by immediate support at the Ichimoku Kijun level ($87.10), while medium- and long-term trends remain bearish with a $80.00–$95.00 consolidation range expected.
ETF approval uncertainty fuels U.S. and European sentiment shifts
Nasdaq has filed a 19b-4 form with the U.S. Securities and Exchange Commission in pursuit of approval for the VanEck JitoSOL ETF, which would offer U.S. investors access to Solana's liquid staking products under regulatory oversight. The SEC’s review process could restrict institutional participation if approval is delayed or denied. Recent regulatory progress in Europe was highlighted by the launch of a Jito-staked Solana product by 21Shares in January, while changes in U.S. tariff policy have also helped drive sector volatility.
Mixed technical signals as intraday recovery meets momentum exhaustion
The Ichimoku Kijun level sits at $87.10, just below current levels, acting as immediate support. Technical momentum is mixed: the daily MACD gives a strong sell reading, the ADX is high and forecasts persistent selling pressure, and the RSI at 44.28 is bearish. The Stochastic RSI is overbought at 85.54, suggesting short-term exhaustion; meanwhile, the CCI is moderately bullish and Bull/Bear Power remains strongly overbought, highlighting dominant buying interest today. Solana recovered from a minor gap down between yesterday's close ($87.46) and today's open ($85.88), trading near the session high ($88.25) amid moderate intraday volatility, but conflicting daily indicators suggest potential exhaustion despite today’s intraday strength.
Downside risk as consolidation persists amid weak breakout odds
Over the next five trading days, typical volatility would indicate a price range between $80.00 and $95.00, with trading expected to cluster near current levels. The likelihood of a significant move above $95.00 is low, below 20%, so further downside risk prevails. In the baseline scenario, SOL consolidates within the $80.00 – $95.00 band as short-term buyers face longer-term selling pressure. A bullish case would need a sustained break above $95.00, while a drop below $80.00 could trigger a deeper correction.
Previously it was reported that Solana is trading above its short-term moving average with modest support, though it remains well below its medium- and long-term averages, signaling persistent selling pressure amid cautious sentiment and large ETF inflows. Daily momentum indicators including MACD and ADX reflect prevailing bearish conditions, with mixed oscillator signals and overbought readings pointing to ongoing consolidation and elevated downside risk, especially if immediate support near $85 fails to hold.


Latest Solana News


-
 Afghanistan
-
 Albania
-
 Algeria
-
 Angola
-
 Argentina
-
 Armenia
-
 Australia
-
 Austria
-
 Azerbaijan
-
 Bahamas
-
 Bahrain
-
 Bangladesh
-
 Belarus
-
 Belgium
-
 Bolivia
-
 Botswana
-
 Brazil
-
 Brunei
-
 Bulgaria
-
 Cambodia
-
 Cameroon
-
 Canada
-
 Chile
Chile
-
 China
China
-
 Colombia
-
 Congo
Congo
-
 Costa Rica
-
 Cote d'Ivoire
-
 Croatia
-
 Cuba
Cuba
-
 Cyprus
-
 Czechia
-
 DR Congo
-
 Denmark
-
 Dominican Republic
-
 Ecuador
-
 Egypt
Egypt
-
 El Salvador
-
 Estonia
-
 Eswatini
-
 Ethiopia
-
 Finland
-
 France
-
 Georgia
-
 Germany
-
 Ghana
Ghana
-
 Greece
-
 Haiti
Haiti
-
 Hong Kong
-
 Hungary
-
 India
India
-
 Indonesia
-
 Iran, Islamic republic
-
 Iraq
Iraq
-
 Ireland
-
 Israel
-
 Italy
Italy
-
 Jamaica
-
 Japan
Japan
-
 Jordan
-
 Kazakhstan
-
 Kenya
Kenya
-
 Korea
Korea
-
 Kuwait
-
 Kyrgyzstan
-
 Laos
Laos
-
 Latvia
-
 Lebanon
-
 Lesotho
-
 Libya
Libya
-
 Lithuania
-
 Luxembourg
-
 Madagascar
-
 Malaysia
-
 Malta
Malta
-
 Mauritius
-
 Mexico
-
 Moldova
-
 Mongolia
-
 Montenegro
-
 Morocco
-
 Mozambique
-
 Myanmar
-
 Namibia
-
 Nepal
Nepal
-
 Netherlands
-
 New Zealand
-
 Nigeria
-
 North Macedonia
-
 Norway
-
 Oman
Oman
-
 Pakistan
-
 Palestine
-
 Panama
-
 Papua New Guinea
-
 Paraguay
-
 Peru
Peru
-
 Philippines
-
 Poland
-
 Portugal
-
 Puerto Rico
-
 Qatar
Qatar
-
 Reunion
-
 Romania
-
 Rwanda
-
 Saudi Arabia
-
 Serbia
-
 Singapore
-
 Slovakia
-
 Slovenia
-
 Somalia
-
 South Africa
-
 Spain
Spain
-
 Sri Lanka
-
 Sweden
-
 Switzerland
-
 Syria
Syria
-
 Taiwan
-
 Tajikistan
-
 Tanzania
-
 Thailand
-
 Trinidad and Tobago
-
 Tunisia
-
 Turkey
-
 UAE
UAE
-
 Uganda
-
 Ukraine
-
 United Kingdom
-
United States
-
 Uruguay
-
 Uzbekistan
-
 Venezuela
-
 Vietnam
-
 Yemen
Yemen
-
 Zambia
-
 Zimbabwe
- Forex
- Crypto
