
Solana price prediction: Will sellers push lower or can SOL hold $73 support?

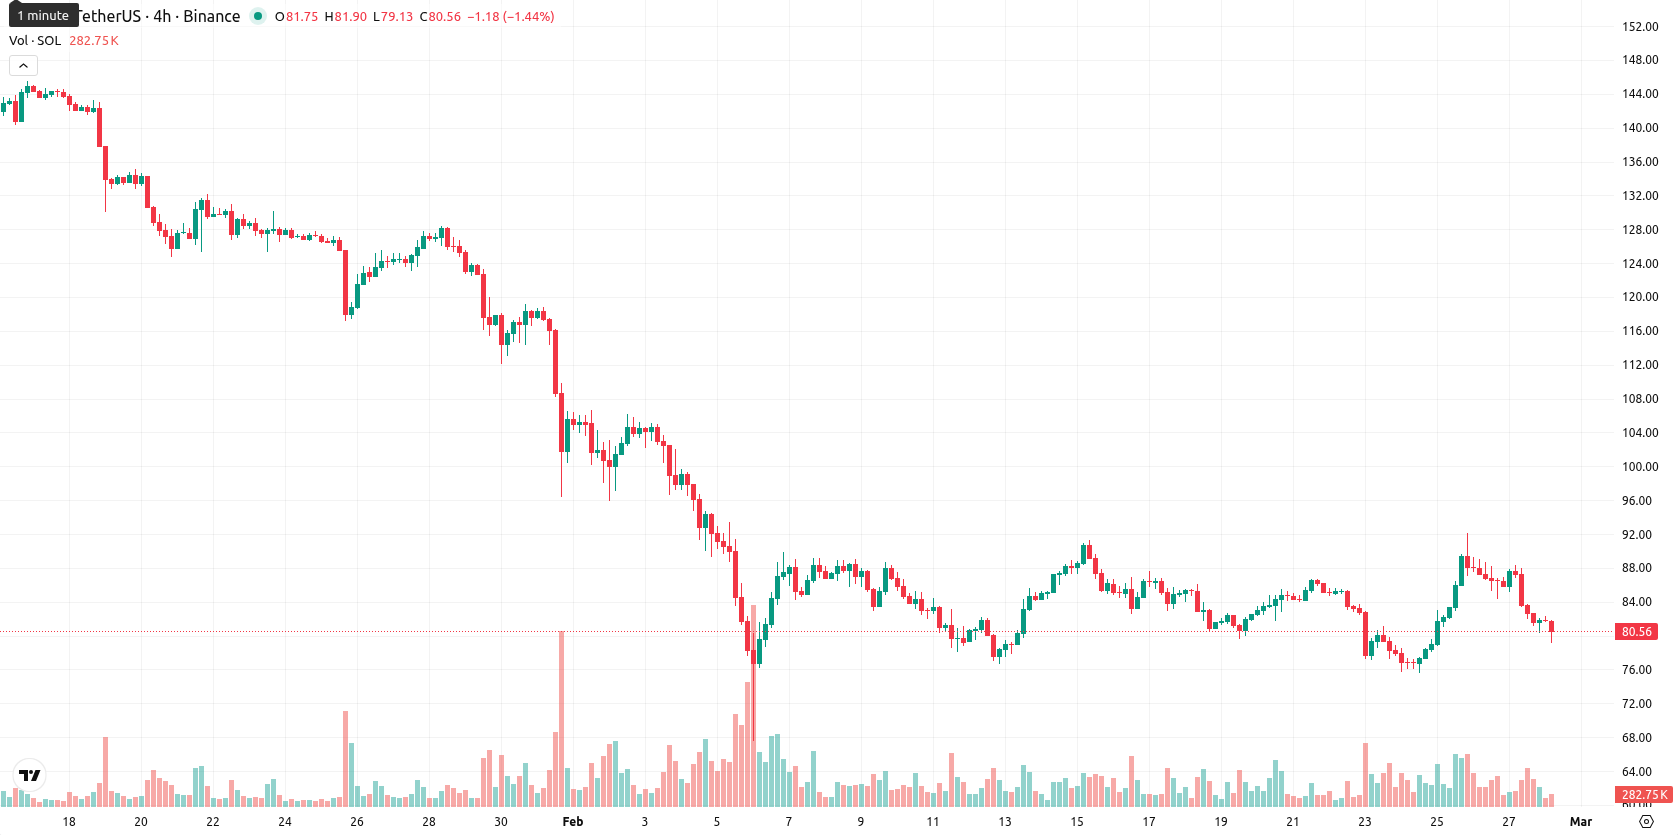
Solana (SOL) is trading at $81.35, which is below the MA-20 ($83.69), MA-50 ($106.86), and MA-200 ($158.00), signaling downtrends across all major timeframes with sustained seller pressure. The Ichimoku Kijun level stands at $86.81, making it an immediate resistance area above the current price.
Highlights
- SoFi enabled direct Solana (SOL) deposits for 13.7 million users on February 27, expanding US bank access to the Solana ecosystem.
- Solana Payments launched amid $2 trillion quarterly stablecoin transfer volume and steady net inflows to SOL spot ETFs, despite persistent price pressure and treasury firm losses.
- SOL trades at $81.35 below key MAs (MA-20: $83.69, MA-50: $106.86, MA-200: $158.00), with $73.00 as near-term support and continued strong downside momentum.
Spot ETF inflows and bank access as ecosystem activity climbs
On February 27, SoFi became the first nationally chartered US bank to enable direct Solana deposits for its 13.7 million users, allowing them to transfer SOL into their crypto accounts. During this period, the Solana ecosystem launched Solana Payments as well as a Payment Hub, and stablecoin transfer volumes on the network reached $2 trillion for the quarter, with monthly payments above $300 million at sub-cent fees. Forward Industries and other treasury firms reported significant unrealized losses as SOL’s price remained under pressure. Solana spot ETFs recorded net inflows throughout February, though price action has remained under broader selling pressure.
Momentum indicators reinforce bearish trend as support weakens
Technical analysis confirms that SOL is trading well below its short- and long-term moving averages, with the MA-20 at $83.69, MA-50 at $106.86, and MA-200 at $158.00, all above the current price and confirming strong downside momentum. The Ichimoku Kijun at $86.81 serves as the nearest resistance, while momentum readings show a strongly bearish MACD, an elevated ADX indicating trend strength, and an RSI at 40.26 with a Stochastic RSI presenting a strong sell signal — both pointing toward emerging oversold conditions. The CCI is neutral, and the Bull/Bear Power shows an “overbought” reading but negative intraday action, highlighting dominant seller activity. Price trades near the lower end of today’s intraday range, and there is no divergence among the main oscillators except for a neutral CCI.
Limited upside as consolidation and downside risks dominate outlook
For the next five trading days, SOL is expected to trade within a typical volatility band of $73.00 to $86.00. There is a very low probability (less than 20%) of an upward reversal, so continued downside or sideways action is favored. The baseline view anticipates a consolidation corridor between $73.00 and $86.00. If a bullish move unfolds, it would require a break above resistance at $86.81, while a bearish scenario would develop if SOL drops below $73.00, exposing further downside this week.
Previously it was reported that Solana is trading above its short-term moving average, showing intraday resilience, but remains under medium- and long-term moving averages with bearish pressure prevailing. Key technical indicators—including a bearish MACD, high ADX, and a low RSI—signal underlying weakness and consolidation near support, suggesting elevated downside risk should the price fall below immediate support levels.


Latest Solana News


-
 Afghanistan
-
 Albania
-
 Algeria
-
 Angola
-
 Argentina
-
 Armenia
-
 Australia
-
 Austria
-
 Azerbaijan
-
 Bahamas
-
 Bahrain
-
 Bangladesh
-
 Belarus
-
 Belgium
-
 Bolivia
-
 Botswana
-
 Brazil
-
 Brunei
-
 Bulgaria
-
 Cambodia
-
 Cameroon
-
 Canada
-
 Chile
Chile
-
 China
China
-
 Colombia
-
 Congo
Congo
-
 Costa Rica
-
 Cote d'Ivoire
-
 Croatia
-
 Cuba
Cuba
-
 Cyprus
-
 Czechia
-
 DR Congo
-
 Denmark
-
 Dominican Republic
-
 Ecuador
-
 Egypt
Egypt
-
 El Salvador
-
 Estonia
-
 Eswatini
-
 Ethiopia
-
 Finland
-
 France
-
 Georgia
-
 Germany
-
 Ghana
Ghana
-
 Greece
-
 Haiti
Haiti
-
 Hong Kong
-
 Hungary
-
 India
India
-
 Indonesia
-
 Iran, Islamic republic
-
 Iraq
Iraq
-
 Ireland
-
 Israel
-
 Italy
Italy
-
 Jamaica
-
 Japan
Japan
-
 Jordan
-
 Kazakhstan
-
 Kenya
Kenya
-
 Korea
Korea
-
 Kuwait
-
 Kyrgyzstan
-
 Laos
Laos
-
 Latvia
-
 Lebanon
-
 Lesotho
-
 Libya
Libya
-
 Lithuania
-
 Luxembourg
-
 Madagascar
-
 Malaysia
-
 Malta
Malta
-
 Mauritius
-
 Mexico
-
 Moldova
-
 Mongolia
-
 Montenegro
-
 Morocco
-
 Mozambique
-
 Myanmar
-
 Namibia
-
 Nepal
Nepal
-
 Netherlands
-
 New Zealand
-
 Nigeria
-
 North Macedonia
-
 Norway
-
 Oman
Oman
-
 Pakistan
-
 Palestine
-
 Panama
-
 Papua New Guinea
-
 Paraguay
-
 Peru
Peru
-
 Philippines
-
 Poland
-
 Portugal
-
 Puerto Rico
-
 Qatar
Qatar
-
 Reunion
-
 Romania
-
 Rwanda
-
 Saudi Arabia
-
 Serbia
-
 Singapore
-
 Slovakia
-
 Slovenia
-
 Somalia
-
 South Africa
-
 Spain
Spain
-
 Sri Lanka
-
 Sweden
-
 Switzerland
-
 Syria
Syria
-
 Taiwan
-
 Tajikistan
-
 Tanzania
-
 Thailand
-
 Trinidad and Tobago
-
 Tunisia
-
 Turkey
-
 UAE
UAE
-
 Uganda
-
 Ukraine
-
 United Kingdom
-
United States
-
 Uruguay
-
 Uzbekistan
-
 Venezuela
-
 Vietnam
-
 Yemen
Yemen
-
 Zambia
-
 Zimbabwe
- Forex
- Crypto
