
Supply halving anticipation and ETF filings trigger volatility — Polkadot drops 7.66%

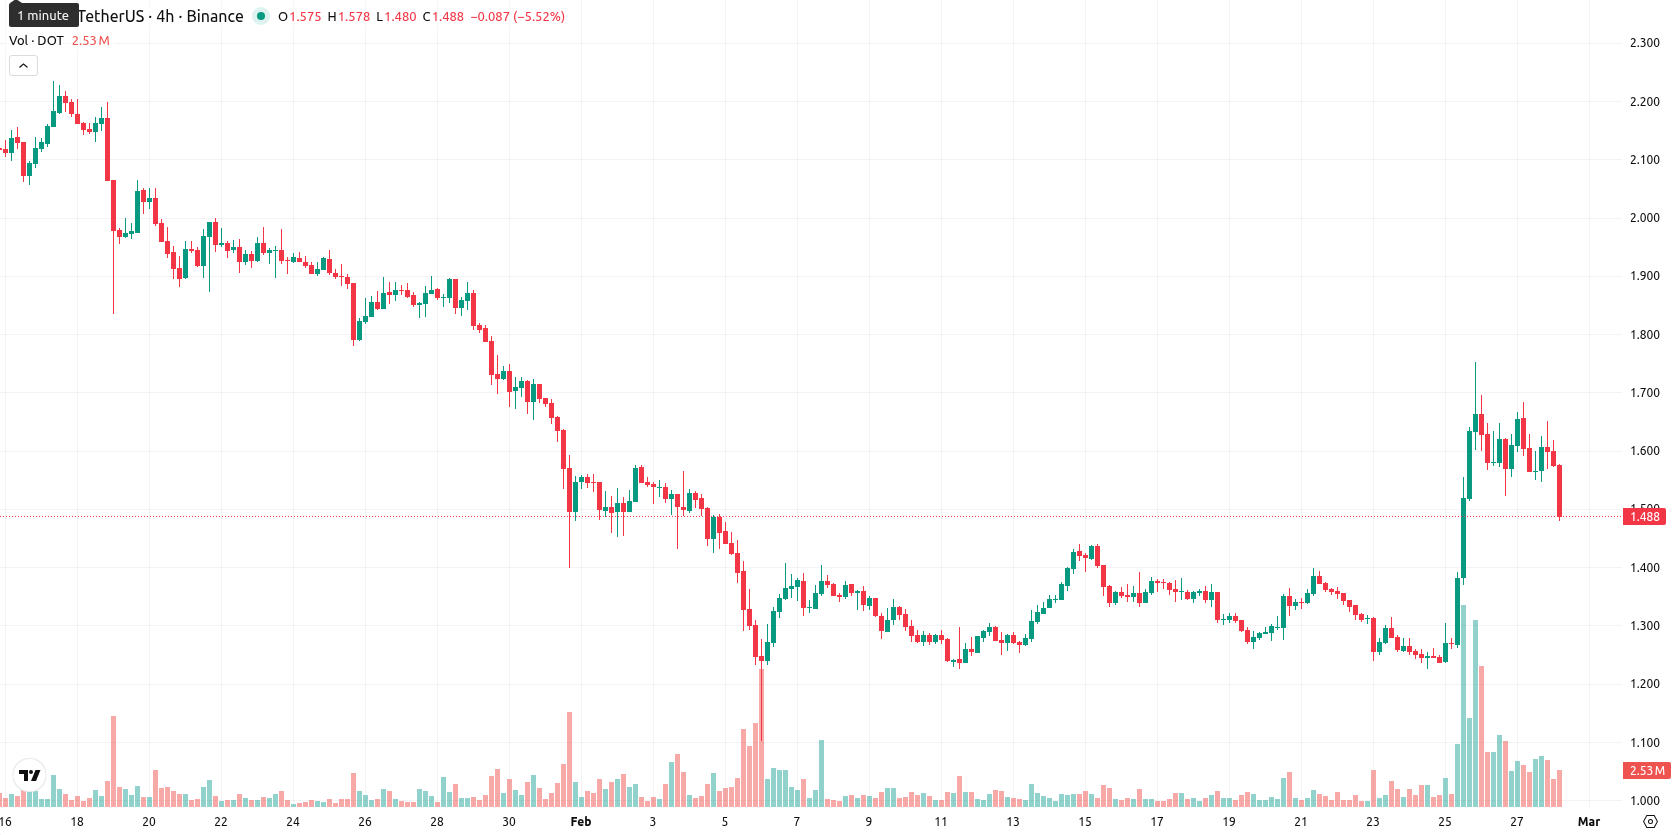
Polkadot (DOT) is trading at $1.495, down 7.66% on the day. The current price sits above the MA-20 ($1.365), but below the MA-50 ($1.653) and MA-200 ($2.736), indicating near-term buying interest while medium- and long-term trends remain under pressure from sellers.
Highlights
- Polkadot’s first-ever supply halving on March 14, 2026, will reduce annual DOT token issuance from about 120 million to 55 million, tightening supply conditions.
- Institutional interest is rising with ETF filings from 21Shares and Grayscale under U.S. SEC review, and DOT being added to the DTCC eligibility list for late 2025.
- DOT trades above its MA-20 ($1.365) but below MA-50 ($1.653) and MA-200 ($2.736), with technicals signaling a high likelihood of further declines unless $1.65 resistance is broken.
Volatile futures flows and ETF filings shape halving-driven supply outlook
Polkadot is approaching its first-ever supply halving on March 14, 2026, which will reduce annual token issuance from about 120 million DOT to 55 million DOT. In recent days, futures open interest for DOT saw sharp swings, peaking above $250 million before falling as long position holders exited, while institutional steps included ETF filings from 21Shares and Grayscale now under U.S. SEC review and DOT being added to the DTCC eligibility list in late 2025. Protocol governance has also imposed a hard supply cap of 2.1 billion DOT and outlined further biennial issuance reductions, though price action has remained under broader selling pressure.
Conflicting momentum signals as price holds above short-term support
On the technical front, DOT trades above the MA-20 but below both the MA-50 and MA-200, pointing to short-term support and ongoing medium- and long-term selling pressure. The Ichimoku Kijun level at $1.426 acts as immediate support, while key resistances sit near $1.65. Momentum indicators are mixed: the ADX signals a strong trend, the MACD flashes a strong sell signal, and the RSI is slightly bullish at 57.38; however, both the Stochastic RSI and Commodity Channel Index show overbought conditions, suggesting the market is stretched. Bull/Bear Power shows moderate buyer strength on the daily chart, despite sellers dominating intraday timeframes. High volatility and a close near the day’s low indicate persistent downside pressure, confirmed by the 7.66% daily drop and diverging oscillators.
Bearish bias dominates as volatility bands constrain upside scenarios
For the coming week, DOT is expected to trade in a range between $1.32 and $1.65, which reflects the typical volatility band relative to current levels. With all weekly trend signals set to 'Sell' or 'Strong Sell', the likelihood of further declines is high, while chances of a sustained rebound remain below 20%. The baseline forecast is for DOT to move sideways near current prices. A break above $1.65 would open a bullish scenario, while a drop below $1.32 could result in deeper declines.
Last time, analysts noted that Polkadot (DOT) experienced a sharp upward move driven by a breakout above key resistance and improving technical structure, supported by strong momentum and positive developments in its ecosystem. Indicators point to enhanced demand amid high staking ratios limiting supply, but elevated volatility persists, with further consolidation dependent on sustained market interest and capital inflows.


Latest Polkadot News


-
 Afghanistan
-
 Albania
-
 Algeria
-
 Angola
-
 Argentina
-
 Armenia
-
 Australia
-
 Austria
-
 Azerbaijan
-
 Bahamas
-
 Bahrain
-
 Bangladesh
-
 Belarus
-
 Belgium
-
 Bolivia
-
 Botswana
-
 Brazil
-
 Brunei
-
 Bulgaria
-
 Cambodia
-
 Cameroon
-
 Canada
-
 Chile
Chile
-
 China
China
-
 Colombia
-
 Congo
Congo
-
 Costa Rica
-
 Cote d'Ivoire
-
 Croatia
-
 Cuba
Cuba
-
 Cyprus
-
 Czechia
-
 DR Congo
-
 Denmark
-
 Dominican Republic
-
 Ecuador
-
 Egypt
Egypt
-
 El Salvador
-
 Estonia
-
 Eswatini
-
 Ethiopia
-
 Finland
-
 France
-
 Georgia
-
 Germany
-
 Ghana
Ghana
-
 Greece
-
 Haiti
Haiti
-
 Hong Kong
-
 Hungary
-
 India
India
-
 Indonesia
-
 Iran, Islamic republic
-
 Iraq
Iraq
-
 Ireland
-
 Israel
-
 Italy
Italy
-
 Jamaica
-
 Japan
Japan
-
 Jordan
-
 Kazakhstan
-
 Kenya
Kenya
-
 Korea
Korea
-
 Kuwait
-
 Kyrgyzstan
-
 Laos
Laos
-
 Latvia
-
 Lebanon
-
 Lesotho
-
 Libya
Libya
-
 Lithuania
-
 Luxembourg
-
 Madagascar
-
 Malaysia
-
 Malta
Malta
-
 Mauritius
-
 Mexico
-
 Moldova
-
 Mongolia
-
 Montenegro
-
 Morocco
-
 Mozambique
-
 Myanmar
-
 Namibia
-
 Nepal
Nepal
-
 Netherlands
-
 New Zealand
-
 Nigeria
-
 North Macedonia
-
 Norway
-
 Oman
Oman
-
 Pakistan
-
 Palestine
-
 Panama
-
 Papua New Guinea
-
 Paraguay
-
 Peru
Peru
-
 Philippines
-
 Poland
-
 Portugal
-
 Puerto Rico
-
 Qatar
Qatar
-
 Reunion
-
 Romania
-
 Rwanda
-
 Saudi Arabia
-
 Serbia
-
 Singapore
-
 Slovakia
-
 Slovenia
-
 Somalia
-
 South Africa
-
 Spain
Spain
-
 Sri Lanka
-
 Sweden
-
 Switzerland
-
 Syria
Syria
-
 Taiwan
-
 Tajikistan
-
 Tanzania
-
 Thailand
-
 Trinidad and Tobago
-
 Tunisia
-
 Turkey
-
 UAE
UAE
-
 Uganda
-
 Ukraine
-
 United Kingdom
-
United States
-
 Uruguay
-
 Uzbekistan
-
 Venezuela
-
 Vietnam
-
 Yemen
Yemen
-
 Zambia
-
 Zimbabwe
- Forex
- Crypto
