
NEAR slides 7.88% as momentum turns negative and resistance holds firm

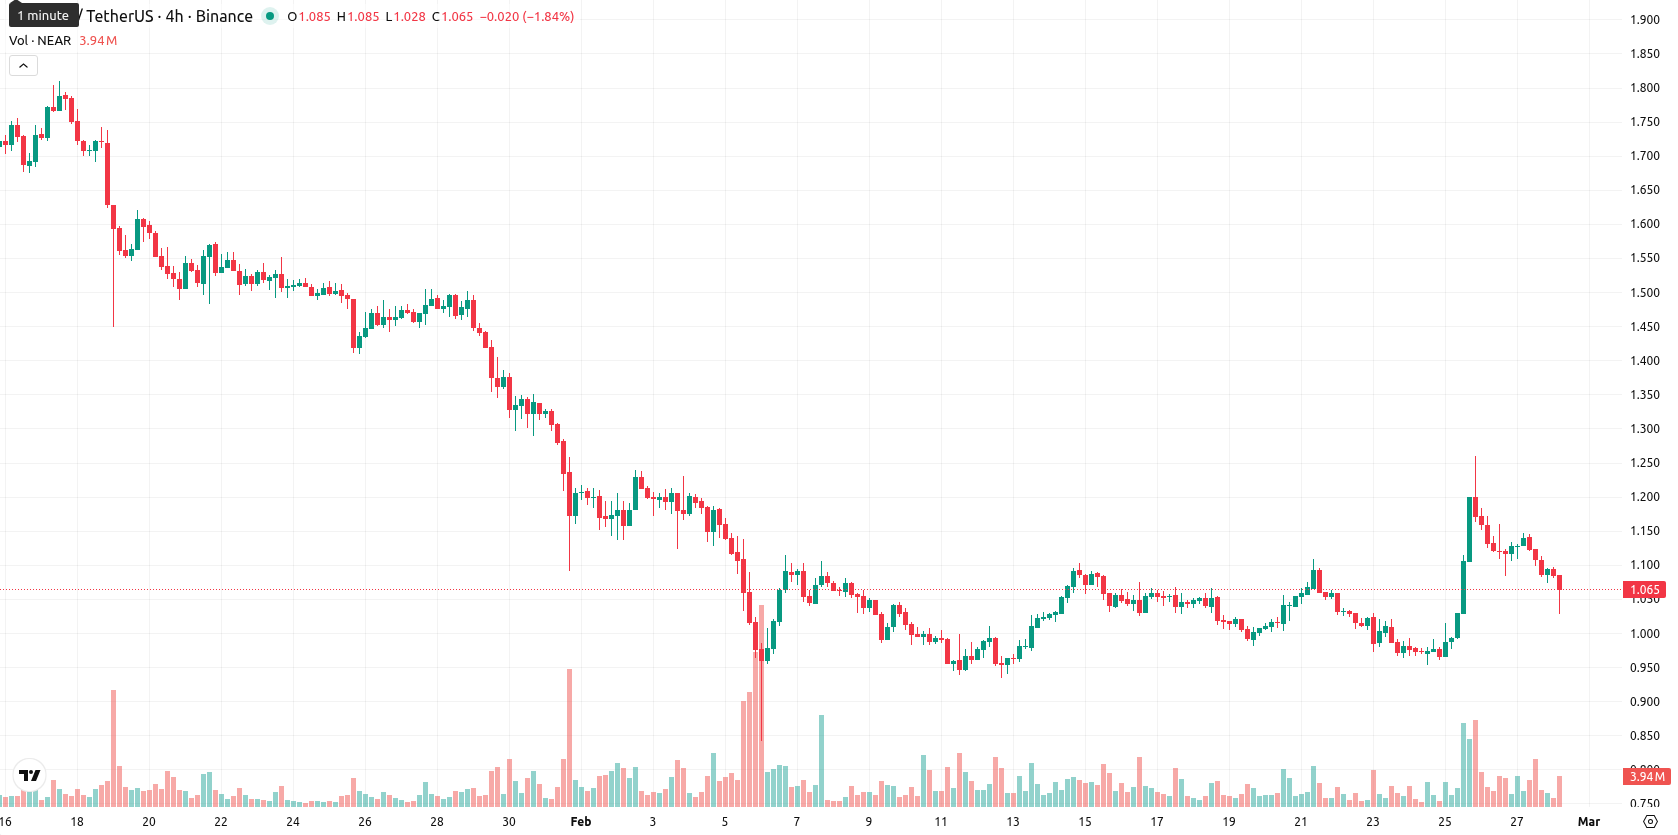
NEAR (NEAR) is trading at $1.0465, having dropped 7.88% for the day. It currently sits just above the MA-20 ($1.0377), but remains well below the MA-50 ($1.2960) and MA-200 ($2.0249), indicating very short-term stabilization while medium- and long-term trends continue to reflect strong selling pressure.
Highlights
- NEAR is trading at $1.0465, marginally above its MA-20 ($1.0377), but remains well below MA-50 ($1.2960) and MA-200 ($2.0249), indicating strong medium- and long-term bearish pressure.
- Momentum signals are broadly bearish as MACD, ADX, and Stochastic RSI indicate strong downward pressure, with a 7.88% drop to a session low of $1.0284 following high intraday volatility.
- Key technical levels are immediate resistance at $1.0505 (Ichimoku Kijun) and support near $1.03; forecasted range for the next 5 days is $0.94–$1.18 with downside risk prevailing.
Bearish momentum persists as mixed oscillator signals emerge
Momentum signals are mostly bearish. The MACD and ADX both indicate a strong downward move, while the RSI stands at 47.7, showing weakening strength. The Stochastic RSI is sending a strong sell signal but not confirming oversold conditions; meanwhile, the Commodity Channel Index suggests overbought, pointing to mixed oscillator readings. The Ichimoku Kijun line at $1.0505 is acting as immediate resistance and Bull/Bear Power is only slightly positive intraday, showing some buyer support but not enough to overcome the dominant downward trend.
Sideways price bias as breakout risks remain limited
Over the next 5 trading days, NEAR is expected to trade within a typical volatility band between $0.94 and $1.18. The probability of a significant upward move remains low (below 20%). The most likely scenario is for prices to move sideways between immediate support at $1.03 and resistance at $1.05. If further weakness develops below $1.03, a move toward $0.94 or lower becomes more likely, with the medium- and long-term outlook still favoring sellers; a bullish breakout above $1.05 could push a test of $1.18.
Previously it was reported that NEAR is exhibiting short-term bullish momentum above its 20-day moving average, yet medium- and long-term moving averages and technical indicators such as the MACD and ADX continue to signal broader bearish trends. Despite current consolidation with support near $1.0850 and resistance around $1.20, overbought oscillators and mixed momentum suggest elevated volatility and caution for the near term.


Latest NEAR News


-
 Afghanistan
-
 Albania
-
 Algeria
-
 Angola
-
 Argentina
-
 Armenia
-
 Australia
-
 Austria
-
 Azerbaijan
-
 Bahamas
-
 Bahrain
-
 Bangladesh
-
 Belarus
-
 Belgium
-
 Bolivia
-
 Botswana
-
 Brazil
-
 Brunei
-
 Bulgaria
-
 Cambodia
-
 Cameroon
-
 Canada
-
 Chile
Chile
-
 China
China
-
 Colombia
-
 Congo
Congo
-
 Costa Rica
-
 Cote d'Ivoire
-
 Croatia
-
 Cuba
Cuba
-
 Cyprus
-
 Czechia
-
 DR Congo
-
 Denmark
-
 Dominican Republic
-
 Ecuador
-
 Egypt
Egypt
-
 El Salvador
-
 Estonia
-
 Eswatini
-
 Ethiopia
-
 Finland
-
 France
-
 Georgia
-
 Germany
-
 Ghana
Ghana
-
 Greece
-
 Haiti
Haiti
-
 Hong Kong
-
 Hungary
-
 India
India
-
 Indonesia
-
 Iran, Islamic republic
-
 Iraq
Iraq
-
 Ireland
-
 Israel
-
 Italy
Italy
-
 Jamaica
-
 Japan
Japan
-
 Jordan
-
 Kazakhstan
-
 Kenya
Kenya
-
 Korea
Korea
-
 Kuwait
-
 Kyrgyzstan
-
 Laos
Laos
-
 Latvia
-
 Lebanon
-
 Lesotho
-
 Libya
Libya
-
 Lithuania
-
 Luxembourg
-
 Madagascar
-
 Malaysia
-
 Malta
Malta
-
 Mauritius
-
 Mexico
-
 Moldova
-
 Mongolia
-
 Montenegro
-
 Morocco
-
 Mozambique
-
 Myanmar
-
 Namibia
-
 Nepal
Nepal
-
 Netherlands
-
 New Zealand
-
 Nigeria
-
 North Macedonia
-
 Norway
-
 Oman
Oman
-
 Pakistan
-
 Palestine
-
 Panama
-
 Papua New Guinea
-
 Paraguay
-
 Peru
Peru
-
 Philippines
-
 Poland
-
 Portugal
-
 Puerto Rico
-
 Qatar
Qatar
-
 Reunion
-
 Romania
-
 Rwanda
-
 Saudi Arabia
-
 Serbia
-
 Singapore
-
 Slovakia
-
 Slovenia
-
 Somalia
-
 South Africa
-
 Spain
Spain
-
 Sri Lanka
-
 Sweden
-
 Switzerland
-
 Syria
Syria
-
 Taiwan
-
 Tajikistan
-
 Tanzania
-
 Thailand
-
 Trinidad and Tobago
-
 Tunisia
-
 Turkey
-
 UAE
UAE
-
 Uganda
-
 Ukraine
-
 United Kingdom
-
United States
-
 Uruguay
-
 Uzbekistan
-
 Venezuela
-
 Vietnam
-
 Yemen
Yemen
-
 Zambia
-
 Zimbabwe
- Forex
- Crypto
