
Sui drops 12.55% as bearish technicals persist despite first spot ETF debut

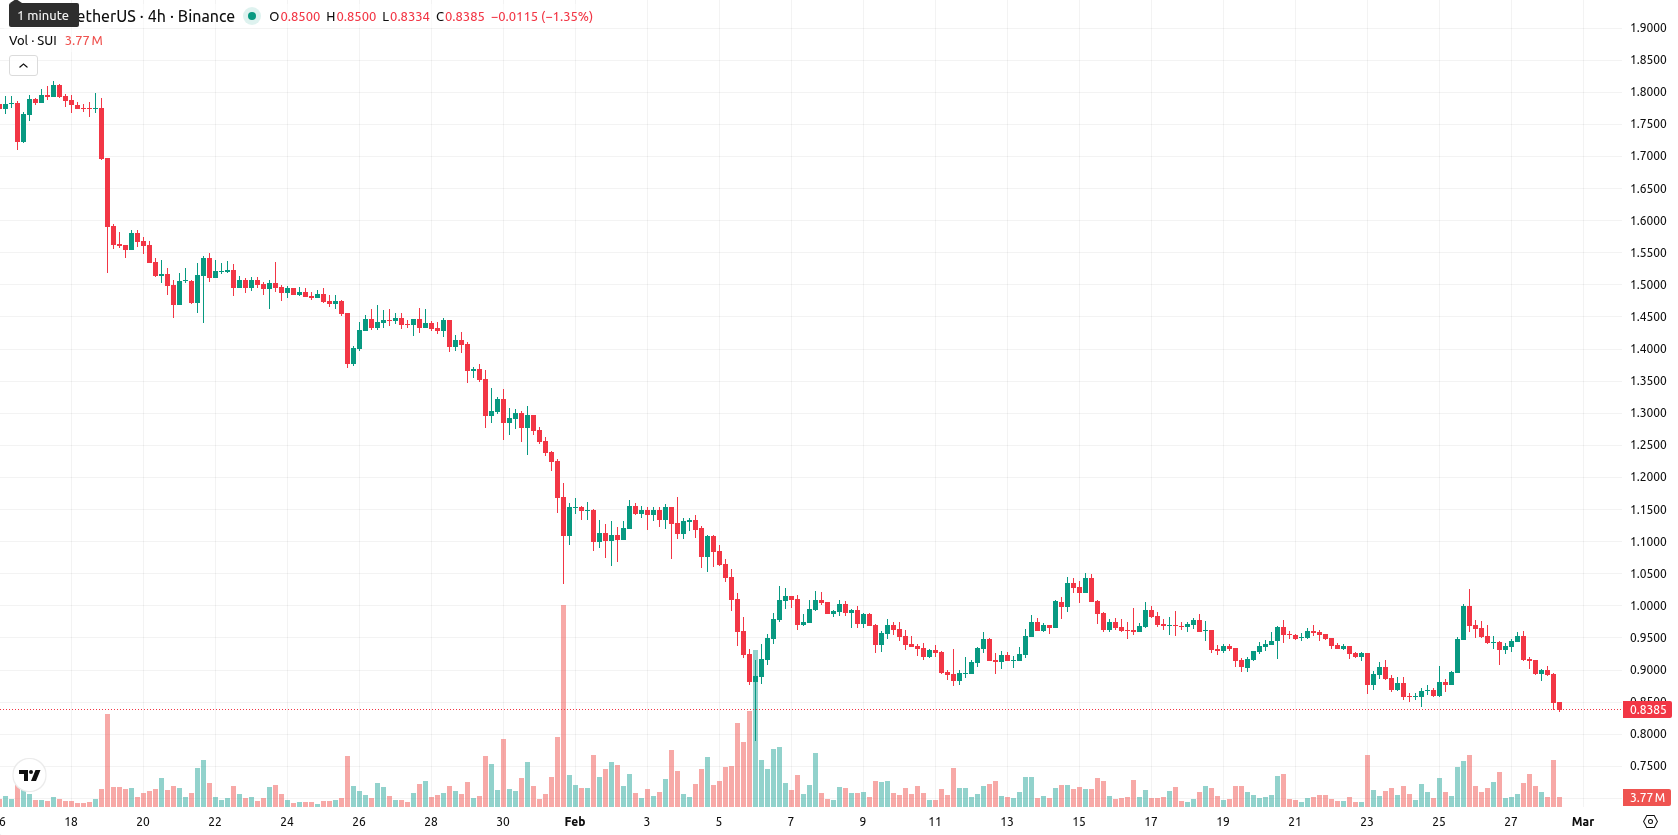
Sui (SUI) is trading at $0.8386 after a daily decline of 12.55%, remaining well below the MA-20 at $0.9420, MA-50 at $1.2520, and MA-200 at $2.2021. The asset is positioned under key moving averages, reflecting sustained selling pressure across all time horizons.
Highlights
- 21Shares launched the first spot Sui ETF (NASDAQ: TSUI) on February 24, 2026, offering direct Sui token exposure on Nasdaq.
- Sui Group (NASDAQ: SUIG) reported a 179% quarterly revenue jump to $2.4 million from staking and lending but incurred a net loss of $221.8 million due to asset losses.
- SUI trades at $0.8386, well below MA-20 ($0.9420), with persistent bearish momentum signaling high risk of further downside toward $0.7550 support.
ETF launches and corporate gains as selling pressures cap Sui’s rally
On February 24, 2026, 21Shares launched the first spot Sui ETF (NASDAQ: TSUI) on Nasdaq, offering direct exposure to the Sui token. In the same period, Sui Group (NASDAQ: SUIG) reported a 179% increase in quarterly revenue to $2.4 million, primarily driven by staking and lending activities, while recording a net loss of $221.8 million due to asset losses and expanding its SUI treasury to over 100 million tokens. Additional developments included the launch of Sui Staking ETF products by Grayscale on NYSE Arca and enhancements to Sui Group's board and partnerships within the digital asset sector, though price action has remained under broader selling pressure.
Bearish momentum confirmed by indicators and rising resistance barriers
Momentum indicators on the daily timeframe underscore a strong bearish bias, with both MACD and ADX signaling a clear downward trend. The Relative Strength Index and Commodity Channel Index both point to prevailing weakness but are not yet deeply oversold, while Stochastic RSI registers strong sell yet stays above typical oversold territory. Bull/Bear Power readings and forecasts confirm dominant seller control on an intraday basis. The Ichimoku Kijun level at $0.9783 and visible gap down at the open reinforce resistance and recent high volatility, with the price currently near today's low — all momentum signals confirm severe intraday selling and no significant divergence among oscillators.
Limited rebound prospects as technicals favor extended downside risk
Over the next five trading days, SUI is likely to fluctuate within a volatility band relative to current levels, with a probable range between $0.7550 and $0.9200 around the $0.8386 midpoint. The probability of a price increase remains low (less than 20%), with technical signals favoring a downside scenario. Sustained moves above immediate resistance at $0.9783 are required for a bullish turn, while any persistent breakdown below $0.7550 could trigger further declines. Unless sentiment shifts, price action is expected to remain confined within this lower corridor.
Previously it was reported that SUI is exhibiting short-term buyer momentum above its 20-day moving average, but remains in a pronounced medium- and long-term downtrend as it trades well below the 50-day and 200-day moving averages. Key momentum indicators, including a strong sell signal from the MACD, a robust trend via ADX, and an overbought Stochastic RSI, reflect mixed signals, with immediate resistance near the Ichimoku Kijun and downside risk outweighing the probability of a breakout in forthcoming sessions.


-
 Afghanistan
-
 Albania
-
 Algeria
-
 Angola
-
 Argentina
-
 Armenia
-
 Australia
-
 Austria
-
 Azerbaijan
-
 Bahamas
-
 Bahrain
-
 Bangladesh
-
 Belarus
-
 Belgium
-
 Bolivia
-
 Botswana
-
 Brazil
-
 Brunei
-
 Bulgaria
-
 Cambodia
-
 Cameroon
-
 Canada
-
 Chile
Chile
-
 China
China
-
 Colombia
-
 Congo
Congo
-
 Costa Rica
-
 Cote d'Ivoire
-
 Croatia
-
 Cuba
Cuba
-
 Cyprus
-
 Czechia
-
 DR Congo
-
 Denmark
-
 Dominican Republic
-
 Ecuador
-
 Egypt
Egypt
-
 El Salvador
-
 Estonia
-
 Eswatini
-
 Ethiopia
-
 Finland
-
 France
-
 Georgia
-
 Germany
-
 Ghana
Ghana
-
 Greece
-
 Haiti
Haiti
-
 Hong Kong
-
 Hungary
-
 India
India
-
 Indonesia
-
 Iran, Islamic republic
-
 Iraq
Iraq
-
 Ireland
-
 Israel
-
 Italy
Italy
-
 Jamaica
-
 Japan
Japan
-
 Jordan
-
 Kazakhstan
-
 Kenya
Kenya
-
 Korea
Korea
-
 Kuwait
-
 Kyrgyzstan
-
 Laos
Laos
-
 Latvia
-
 Lebanon
-
 Lesotho
-
 Libya
Libya
-
 Lithuania
-
 Luxembourg
-
 Madagascar
-
 Malaysia
-
 Malta
Malta
-
 Mauritius
-
 Mexico
-
 Moldova
-
 Mongolia
-
 Montenegro
-
 Morocco
-
 Mozambique
-
 Myanmar
-
 Namibia
-
 Nepal
Nepal
-
 Netherlands
-
 New Zealand
-
 Nigeria
-
 North Macedonia
-
 Norway
-
 Oman
Oman
-
 Pakistan
-
 Palestine
-
 Panama
-
 Papua New Guinea
-
 Paraguay
-
 Peru
Peru
-
 Philippines
-
 Poland
-
 Portugal
-
 Puerto Rico
-
 Qatar
Qatar
-
 Reunion
-
 Romania
-
 Rwanda
-
 Saudi Arabia
-
 Serbia
-
 Singapore
-
 Slovakia
-
 Slovenia
-
 Somalia
-
 South Africa
-
 Spain
Spain
-
 Sri Lanka
-
 Sweden
-
 Switzerland
-
 Syria
Syria
-
 Taiwan
-
 Tajikistan
-
 Tanzania
-
 Thailand
-
 Trinidad and Tobago
-
 Tunisia
-
 Turkey
-
 UAE
UAE
-
 Uganda
-
 Ukraine
-
 United Kingdom
-
United States
-
 Uruguay
-
 Uzbekistan
-
 Venezuela
-
 Vietnam
-
 Yemen
Yemen
-
 Zambia
-
 Zimbabwe
- Forex
- Crypto
